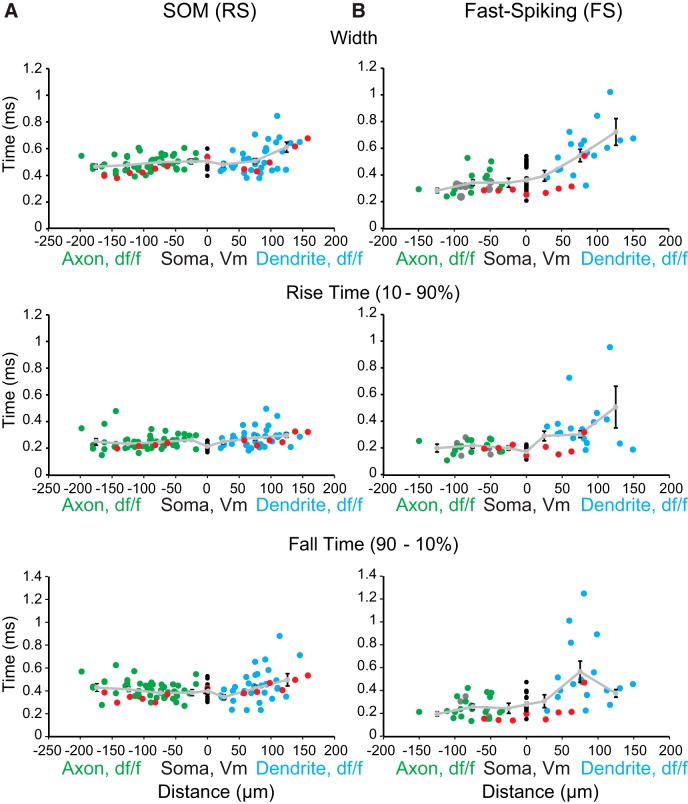
Figure 3.
Axonal and somatic action potential durations are shorter in FS versus SOM-expressing (RS) interneurons. A, Left, Action potential width at half-amplitude, 10%–90% rise time, and 90%–10% fall time of fluorescence transients in the axon (green), dendrite (blue), and electrically recorded at the soma (black) of SOM interneurons in response to single action potentials plotted as a function of distance (n = 18 cells). Light gray line shows mean ± SEM of population measures over distance in 50 μm bins. B, Right, Same as for A, but for FS interneurons (n = 22 cells). Gray circles (right) represent axonal measurements calculated as linear distance from the soma (n = 6 cells). Red circles represent measurements recorded from a single cell in which we imaged from both a dendrite and axon.

