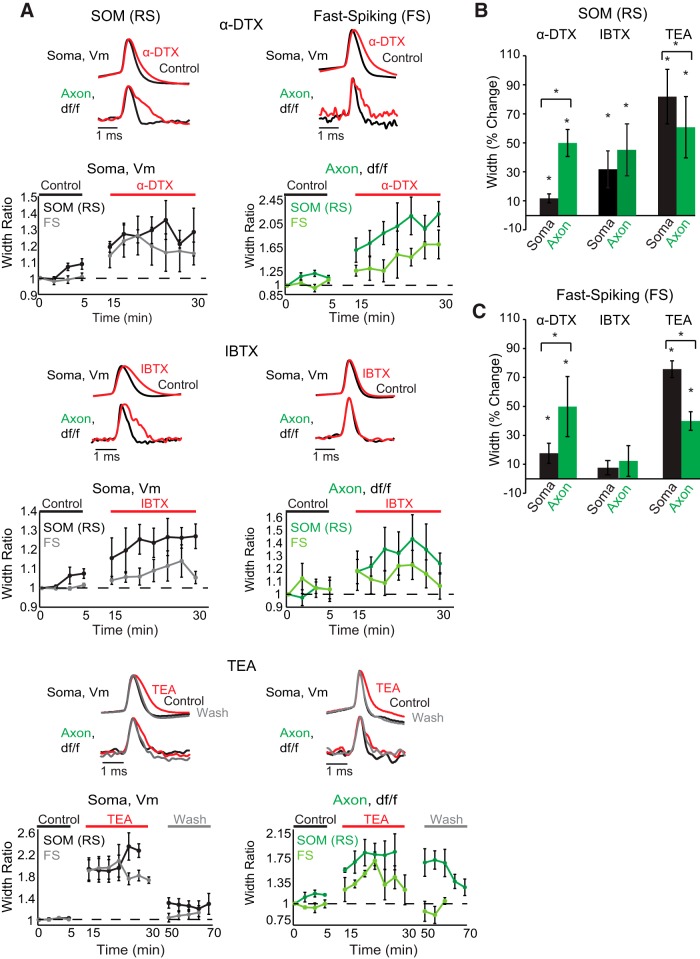
Figure 5.
Somatic and axonal compartments of SOM-expressing (RS) and FS interneurons exhibit differences in sensitivity to potassium channel toxins. A, Examples of action potential waveforms recorded electrically at the soma or optically in the axon during control (black), drug (red), and wash (gray) conditions for each cell type and toxin. Beneath single trial examples are average population time dependence plots of somatic and axonal recordings for each drug and each cell type. Each point shows the average ± SEM width ratio (i.e., the average width over the test population at a given time point compared with the average width of the test population at the start of the experiment) of a single trial recorded across the test population at different time points during control, drug, and washout conditions. Concentrations: 1 mm TEA, 100 nm IBTX, 100 nm α-DTX. SOM IBTX and FS α-DTX were recorded at an optical sampling frequency of 20 kHz. Optical and electrical traces are normalized to peaks. Optical traces are averages of between two and eight trials. B, Summary of drug effects on the action potential width at half-height expressed as a percentage of control values (average ± SEM) for each SOM interneuron compartment (black represents soma; green represents axon). C, Same as in B, but for FS interneuron compartments. *Statistical significance at p < 0.05(one-tailed Wilcoxon signed-rank test for within compartment comparisons and two-tailed Wilcoxon signed-rank test for across compartment comparisons).

