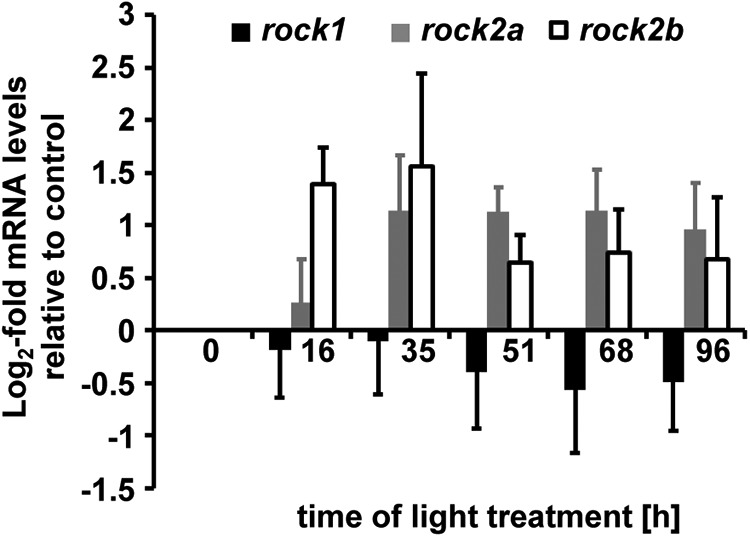
Figure 5.

Temporal mRNA expression patterns of rocks. mRNA was isolated from dark-adapted undamaged (0 h) and light-damaged retinas (16–96 h) and expression levels were analyzed by qRT-PCR. Both rock2a and rock2b expression increased in light-damaged retinas relative to undamaged controls (0 h), although not significantly. In contrast, rock1 mRNA remained relatively constant. Data are shown as mean ± SE, n ≥ 3, ANOVA, p > 0.05.
