Figure 2.
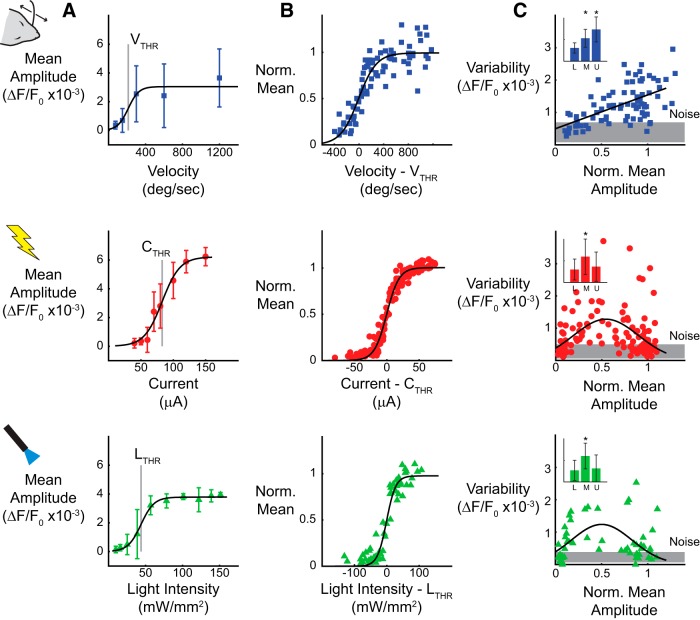
Whisker stimuli are more sensitive to trial-to-trial variability. A, The response amplitude was quantified as the maximum VSDI signal, after averaging spatially within a single cortical column and across trials, for whisker, electrical, and optical stimuli. B, Tuning curves for velocity (top, n = 12), current (middle, n = 18), and light intensity (bottom, n = 6) across all experiments. Stimulus values from each experiment were normalized relative to the threshold stimulus. Mean response values from each experiment were normalized with respect to the amplitude of the sigmoidal fit. C, The variability in the response amplitude was quantified as the SD of the maximum amplitude across trials, averaged spatially within a single cortical column. The response amplitude variability for whisker stimuli (top) increases as a function of mean response amplitude (n = 12). The response amplitude variability for electrical (middle) and optical (bottom) stimuli peak at the threshold response amplitude (n = 18 for electrical, n = 6 for optical). Inset depicts all data binned into three equally sized groups to demonstrate variability trends (* indicates p < 0.05, two-sided t test with unequal variances).

