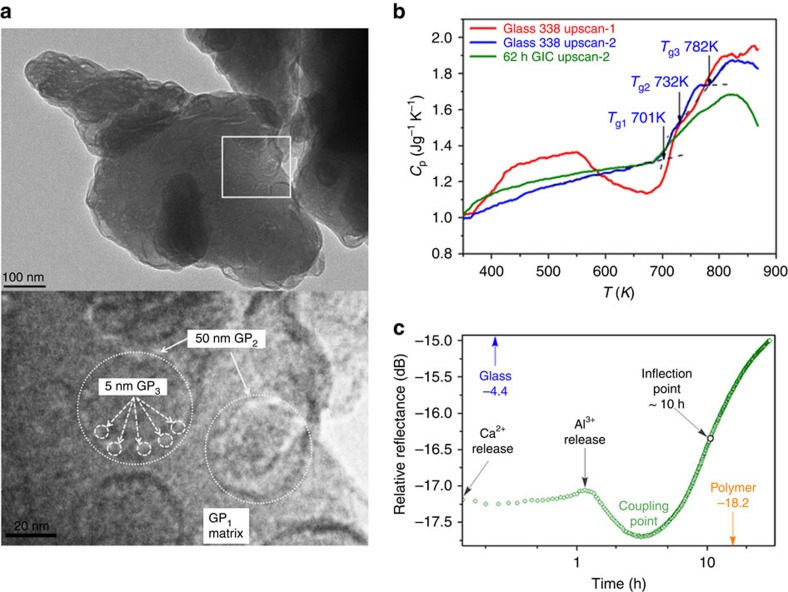
Figure 2. GIC characterization.
(a) TEM image of individual glass particle (above, scale bar, 100 nm) with three distinguishable glass phases: GP1, GP2 and GP3 seen on an expansion of the white frame area (below, scale bar, 20 nm, see text for details). (b) Three DSC upscan curves for the fresh G338 glass (red), the G338 glass subjected to the first up- and downscans (blue), and the GIC sample (green) subjected to 62 h setting and the subsequent up- and downscans, respectively. The red curve exhibits a water-loss endothermic response, followed by an exothermic enthalpy-release response; the blue upscan-2 curve reveals three sharp glass transitions Tg1, Tg2 and Tg3, which we associate with the glass phases GP1, GP2 and GP3, respectively; the green curve reveals how glass transitions are modified by setting. Both up- and downscan rates are 20 K min−1. (c) Coherent terahertz spectroscopy: changing sub-THz relative reflectance during setting, differentiating gel formation (Ca+2 and Al3+release) from chelation (Al+3 release); minimum (CP) identifies the point where glass and polymer couple dynamically.

