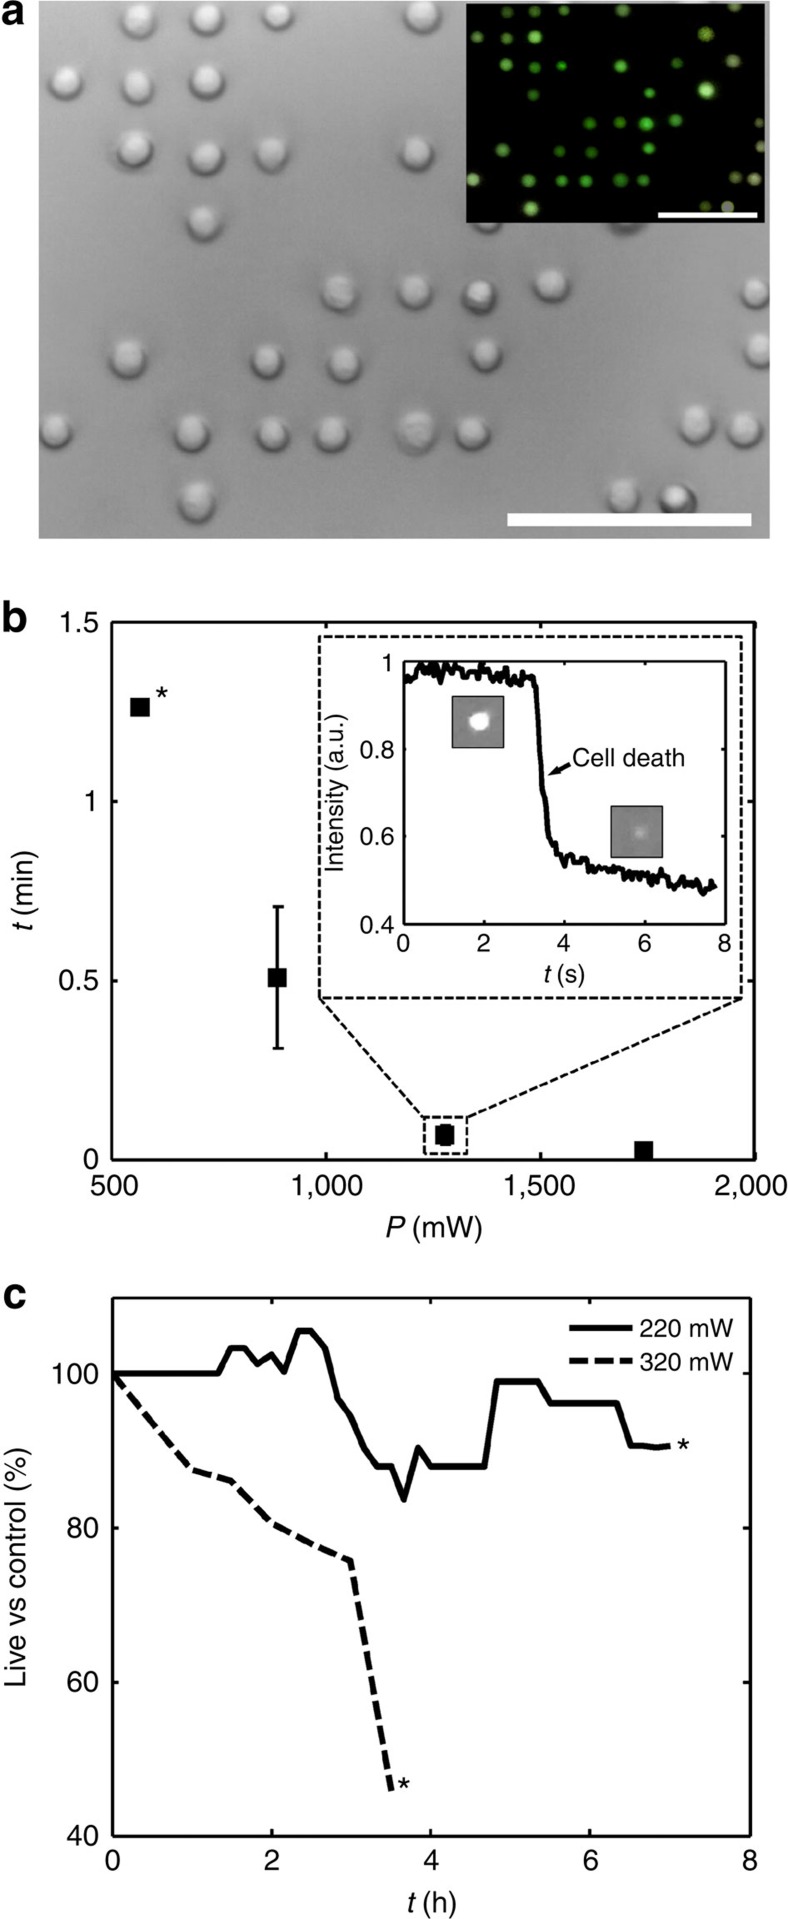
Figure 9. Lymphocyte trapping and viability.
(a) Human peripheral blood mononuclear cell (PBMC) lymphocytes are simple to pattern as compared with RBCs due to their spherical shape. Inset shows a fluorescence image of carboxyfluorescein succinimidyl ester (CFSE)-infiltrated lymphocytes, a membrane leakage assay that demonstrates cell viability. Cells are patterned in a 126-MHz field from a continuous flow at 0.5 μl min−1 at 0.22 W, from an input concentration of 4,500 cells per μl to a local patterned concentration ∼100 × this. Supplementary Movie 2 shows individual cell capture in the array. Scale bar, 50 μm. (b) The power level limits the maximum exposure time, with the inset showing an example control-normalized fluorescence intensity measurement of membrane integrity loss (field applied at t=0). The time to lysis is strongly dependent on the applied power: although all continuously monitored cells (population (pop.) 11) are lysed within 49 s at 890 mW, only one is observed to do so at 570 mW within the ≈5-min period before photobleaching rendered the sample unusable, as denoted by (*). Error bars denote 1 s.d. for observed death times of 11 cells at 890/1,280/1,740 mW. (c) Below this threshold power (∼1 μW μm−2), cells can be trapped for increased periods with negligible effects on cell viability, here showing the long-term comparison of viable cells (pop. 50/48 cells for 220/320 mW studies) to a control (cells from same population incubated simultaneously in identical chamber without SAW, total pop. 57). Photobleaching of the sample (at *) is avoided for this duration through selective shuttering of the light source.

