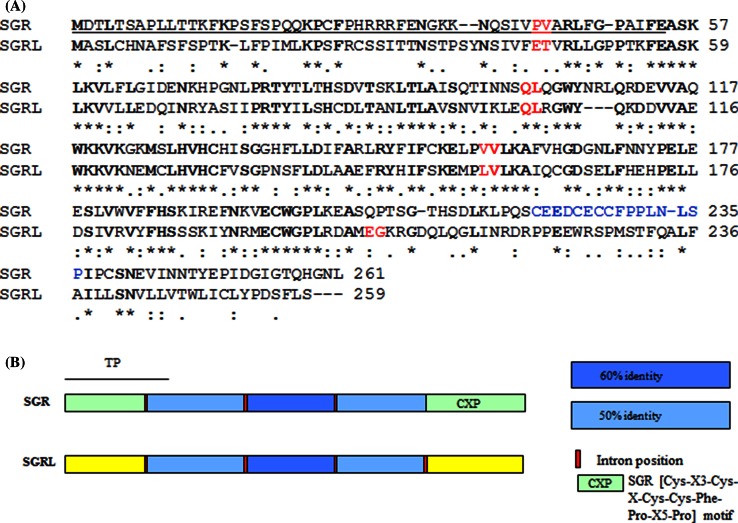
Fig. 1.
a Comparison of the protein sequences deduced for SGR and SGRL genes from pea. The positions of introns in the corresponding genes are indicated by amino acids in red font, with the predicted transit peptide of SGR underlined. The protein sequences show 50 % identity (bold, *) and 68 % similarity overall. A fourth intron in SGRL and the lack of a [Cys–X3–Cys–X–Cys–Cys–Phe–Pro–X5–Pro] motif (blue font in SGR) mark the divergence of SGRL. b Schematic of the two proteins, where regions showing more than 50 % identity are shaded similarly in blue according to the identities shown. Yellow and pale green regions indicate regions that are very divergent between the two proteins. The transit peptide region (TP) of SGR is indicated with a solid line; CXP indicates the [Cys–X3–Cys–X–Cys–Cys–Phe–Pro–X5–Pro] motif (which is in blue font in Fig. 1 a)

