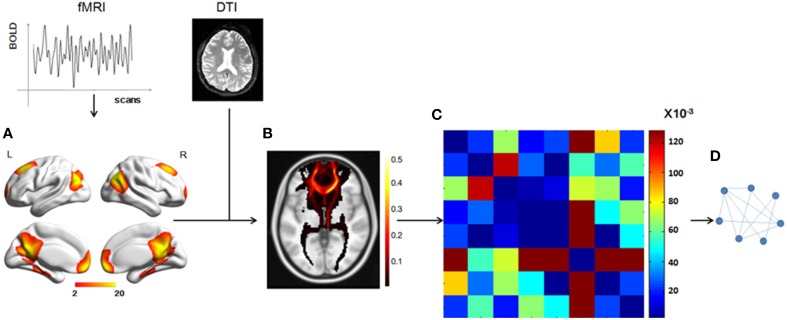
Figure 1.
Total workflow before the statistical analysis. (A) The DMN mask was extracted from fMRI data using group ICA, with a threshold of z = 2. (B) A probabilistic fiber tractography method was used to track the fibers from each ROI and the connectivity probability between any two ROIs was calculated to get the matrix (C). (D) A graph theory method, in which the nodes represented the ROIs and the weighted edges reflected the connectivity probabilities between any two nodes, was used to analyze the DMN structural network.

