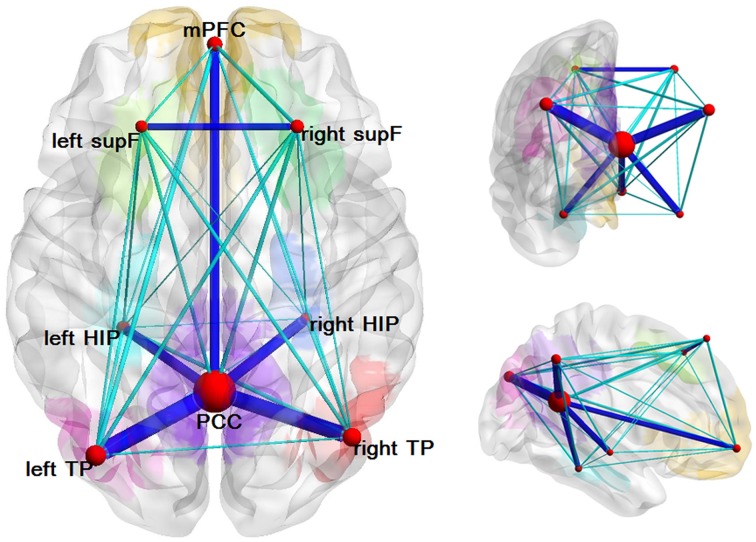
Figure 4.
Structural network of the DMN. Eight ROIs and the structural connectivity between any two regions are shown in this graph. The size of the node corresponds to the degree of the node and the connectivity was thresholded by 0.1 with dark blue indicating values greater than 0.1 and light blue indicating values less than 0.1.

