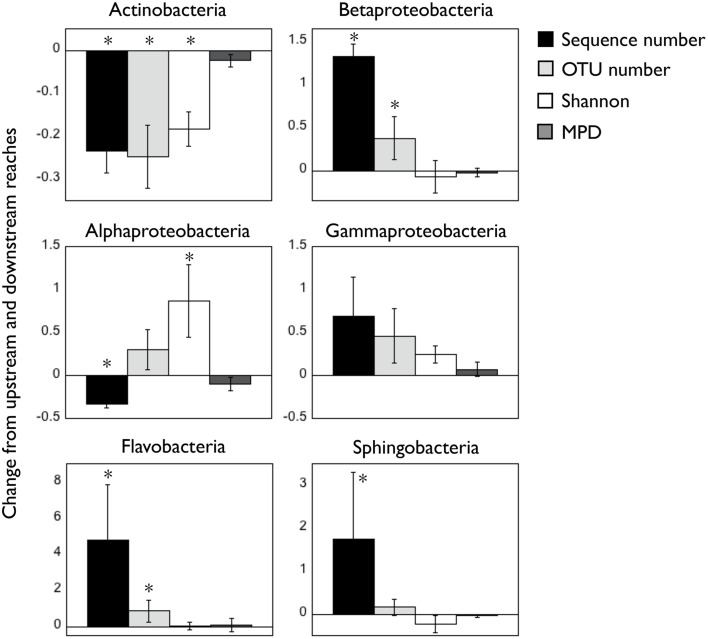
Figure 2.
Change in number of sequences, OTU richness, taxonomic diversity [Shannon], and mean phylogenetic distance [MPD] for the six bacterial classes between up- and downstream reaches. Positive numbers indicate higher average values in upstream waters compared to downstream sites (ratio upstream/downstream), and the opposite is true for negative values. Asterisks indicate significant (p < 0.05) differences in those variables between both reaches. Note the different scales in Y axes. All values were calculated from the rarefied OTU table (1000 sequences/sample, see Materials and Methods) pooling the three samplings together.

