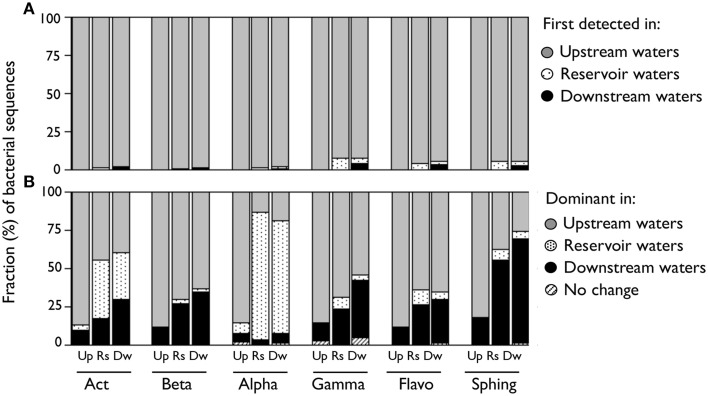
Figure 3.
(A) Proportion of DNA sequences from each bacterial class associated to OTUs categorized by the farthest upstream environment where they were first detected considering a unidirectional flow of water from upstream to downstream. (B) Proportion of DNA sequences from each bacterial class associated to taxa categorized by the environment where they were more abundant. Those OTUs that had the same abundances in either reach were categorized as “No change.” Values are averages of the three samplings and are expressed as a fraction of the total sequences for each reach ([Up] Upstream; [Rs] Reservoir; [Dw] Downstream). This analysis was performed considering the non-rarefied OTU table. [Act] Actinobacteria; [Beta] Betaproteobacteria; [Alpha] Alphaproteobacteria; [Gamma] Gammaproteobacteria; [Flavo] C. Flavobacteria; [Sphing] Sphingobacteria.

