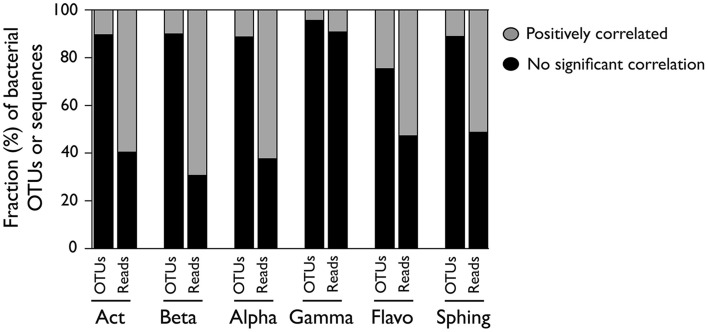
Figure 4.
OTUs within each bacterial class whose abundances were positively or not significantly correlated with the abundance of sequences in their parent class. For each class, the proportion of OTUs (left bar) and the proportion of sequences represented by each of those OTUs (right bar) are presented. Correlations were performed by considering the non-rarefied OTU table and pooling the three samplings together (n = 34), and only Bonferroni-corrected significant (p < 0.05) correlations were considered. [Act] Actinobacteria; [Beta] Betaproteobacteria; [Alpha] Alphaproteobacteria; [Gamma] Gammaproteobacteria; [Flavo] (C). Flavobacteria; [Sphing] Sphingobacteria.

