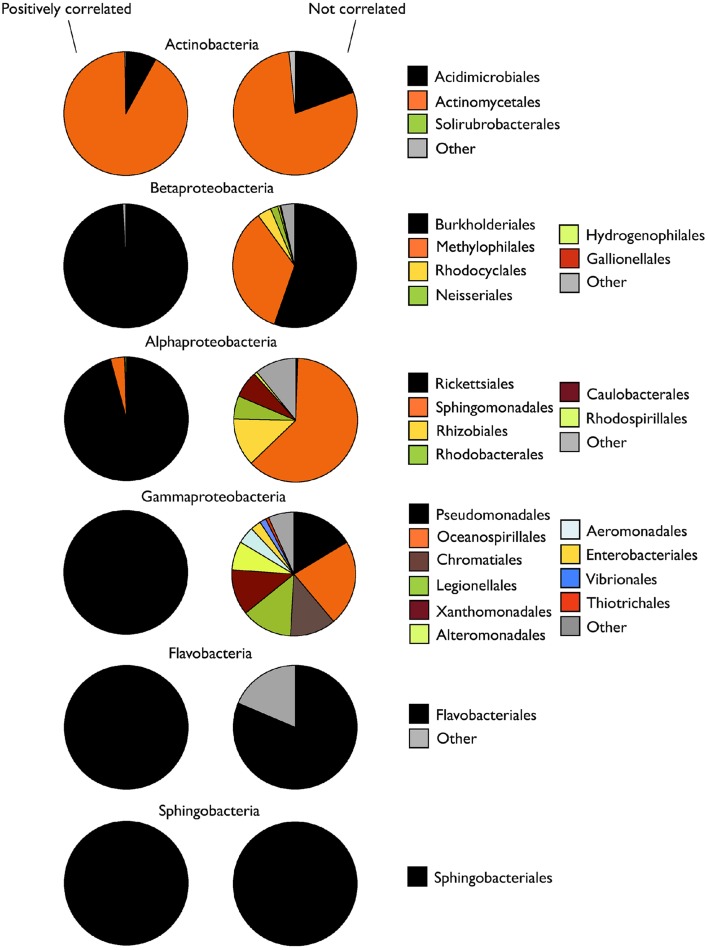
Figure 5.
Taxonomic composition of the OTUs within each bacterial class whose abundances were positively or not significantly correlated with the abundance of sequences of their parent class. Data are presented as percent contribution of each taxonomic order to total sequences (average of the three samplings).

