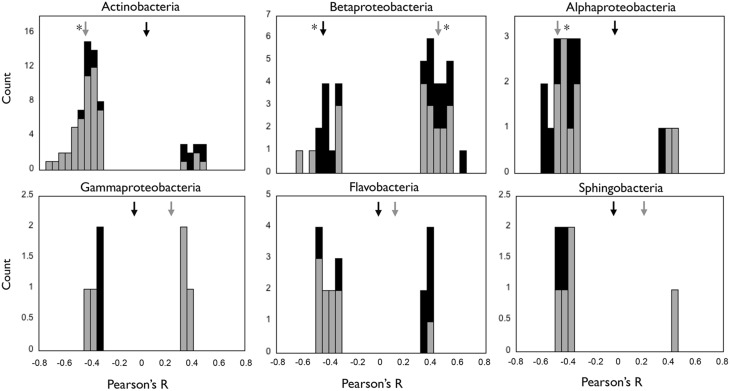
Figure 6.
Distribution of the Pearson's R values of the correlations between individual OTUs and environmental PCA axes PC1 (black bars) and PC2 (gray bars) for each of the six bacterial classes, and R values of the correlations at the class level (arrows). PC1 and PC2 depicted seasonal and spatial variation in environmental conditions, respectively (see Materials and Methods, Figure S4). Only those correlations that were significant (p < 0.05) are shown. Black and gray arrows indicate the R values of the correlation between the class abundance and PC1 and PC2 axes, respectively, and asterisks indicate those cases where these correlations were significant (p < 0.05).

