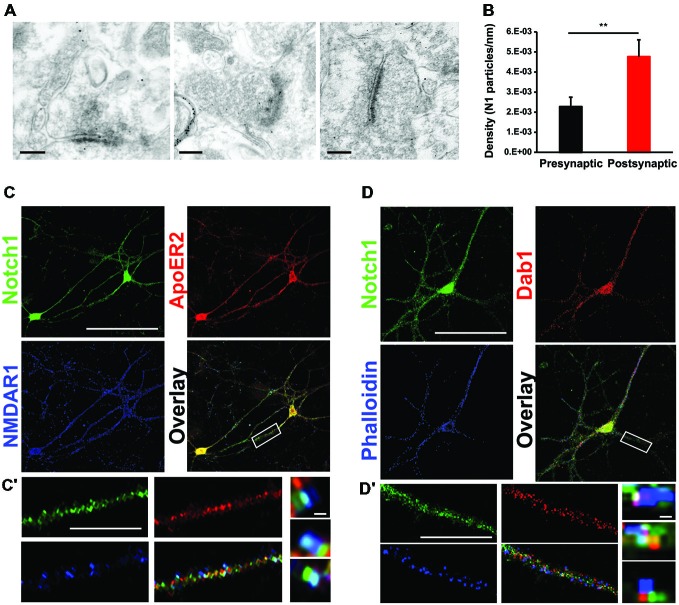
Figure 1.
Notch1 colocalizes postsynaptically with Reelin signaling components. (A) Representative IEM images from hippocampal slices using an antibody specific for Notch1 show that gold particles are localized at postsynaptic as well as presynaptic membrane terminals. (B) Bar graph summarizing the counting of gold particles on the length of presynaptic and postsynaptic membranes indicates that the majority of the Notch1 gold particles are localized postsynaptically (5*10−3 ± 0.8*10−3 vs. 2*10−3 ± 0.4*10−3, n = 3 mice; Student’s t-test, p < 0.01). (C) Fluorescent immunolabeling on 14 days primary neuronal WT cultures shows colocalization of Notch1 and ApoER2 in soma and processes of pyramidal neurons. Both Notch1 and ApoER2 are similarly co-expressed in NMDAR1 positive puncta (R = 0.92 ± 0.03 and R = 0.86 ± 0.08, respectively; Student’s t-test, p = 0.23). (C′) Close up of a dendrite displaying Notch1, ApoER2 and NMDAR1 expression and “zoom in” captions of puncta showing clustering of the three receptors in teal. (D) Fluorescent immunolabeling on primary neuronal cultures shows that Notch1 and Dab1 localize in the same pyramidal neuron’s soma and processes labeled by phalloidin (R = 0.87 ± 0.06 and R = 0.74 ± 0.07 respectively; Student’s t-test, p = 0.5). (D′) Close up of a dendrite with Notch1, Dab1 and F-actin labeling and “zoom in” captions of dendritic puncta showing clustering of Notch1, Dab1 and F-actin in teal. **p < 0.01. Error bars are SEM and scale bar in (A) is 200 nm for all IEM panels, in (C,D) 50 μm and in (C′,D′) 10 μm and 500 nm in zoom in captions.

