Figure 3.
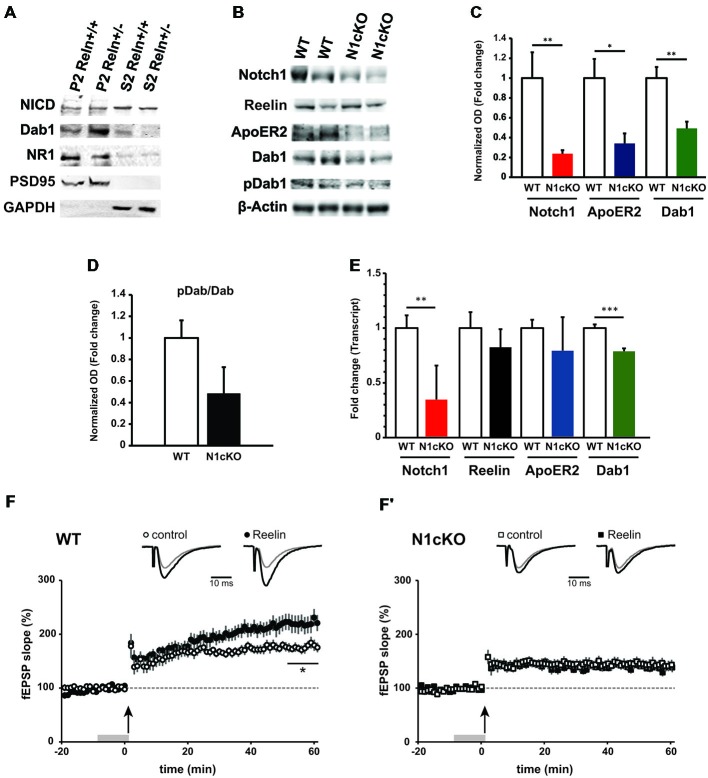
Loss of Notch1 interferes with the Reelin cascade and Reelin-mediated synaptic potentiation. (A) Western blot analysis on synaptosomal (P2) and cytosolic (S2) fractions from the cortex of Reelin heterozygous mice (Reln+/−) and wildtype controls (Reln+/+) shows that total NICD levels are not affected in both compartments. Moreover, Dab1 levels are increased and NMDAR1 expression is unchanged in the haploinsufficient (Reln+/−) mice (n = 3 independent fractionations). (B) Representative immunoblot on whole hippocampal lysates show a reduction in Notch1, ApoER2 and Dab1 expression in the N1cKO as compared to WT. Reelin and Dab1 phosphorylation appear unchanged (n = 3 independent experiments). (C) Bar graph summarizing the optical density analysis of Notch1, ApoER2 and Dab1 bands normalized to β-actin. In N1cKO hippocampi, a 76.2% reduction is observed in Notch1 (n = 6 mice per genotype; Student’s t-test, p < 0.01), a 65.9% reduction in ApoER2 (Student’s t-test, p < 0.05) and 50.7% reduction in Dab1 (n = 5 mice per genotype; Student’s t-test, p < 0.01) as compared to WT controls. (D) Dab1 phosphorylation is not significantly reduced in N1cKO mice (n = 5 mice per genotype; Student’s t-test, p = 0.09) as compared to control littermates. (E) qPCR analysis shows the transcript expression of Notch1, Reelin, ApoER2 and Dab1 in wildtype and N1cKO hippocampi. Dab1 in N1cKO mice is decreased by 20% as compared to WT (n = 4 per genotype; Student’s t-test, p < 0.001). Reelin and ApoER2 transcripts do not change. Notch1 transcript is reduced by 65% in N1cKO mice (n = 4 per genotype; Student’s t-test, p < 0.01). (F,F′) Field EPSPs (fEPSPs) were elicited in CA1 stratum radiatum by Schaffer collateral stimulation. LTP was induced with TBS. Upper traces represent average fEPSP recorded during baseline (gray) and 50 min after TBS (black). (F) In WT, superfusion of Reelin-conditioned medium (Rln) 10 min prior to TBS (gray bar) induces and promotes LTP (•, n = 9 slices, 6 mice) as compared to control medium (ctr; °, n = 9 slices, 7 mice; Student’s t-test, p < 0.05). (F′) In N1cKO mice, LTP is impaired in both Rln and control conditions (□, n = 9 slices, 4 mice; ▪, n = 9 slices, 5 mice; p = 0.63). *p = < 0.05, Data are averages ± SEM.

