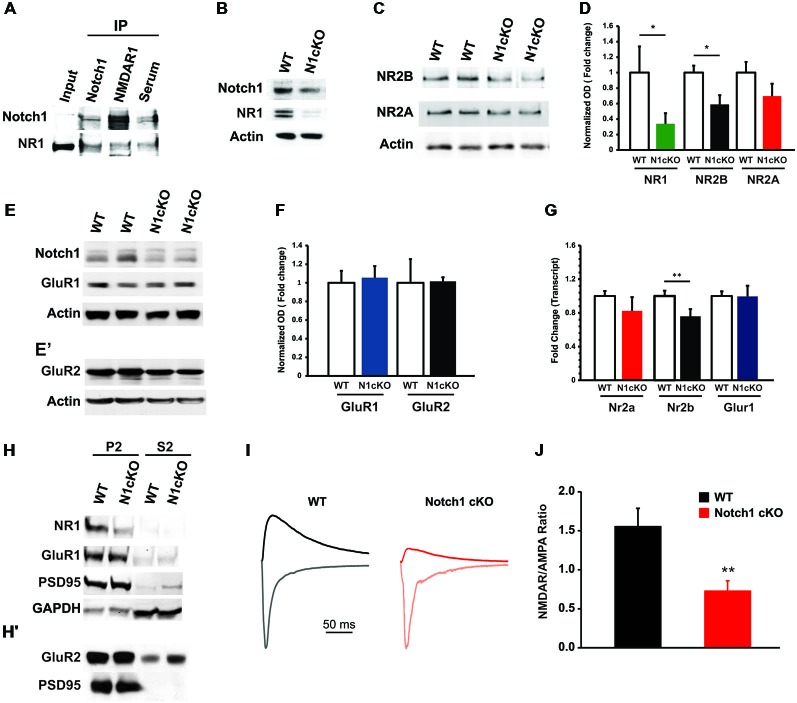
Figure 4.
Notch1 affects NMDAR composition and conductance. (A) Western blot on co-IPed synaptosomal fraction shows that Notch1 and NMDAR1 physically interact (n = 3 independent experiments). (B) Representative western blot on WT and N1cKO whole hippocampal lysates indicates that NR1 is visibly reduced in the N1cKO (n = 5 independent experiments). (C) Immunoblot on whole hippocampal lysate indicates a reduction in NR2B expression in the N1cKO as compared to WT. NR2A does not appear affected (n = 4 independent experiments). (D) Bar graph summarizing the changes in protein expression of NR1, NR2B and NR2A normalized against β-actin. NR1 expression is reduced by 66.1% in the N1cKO mice (n = 6 mice per genotype; Student’s t-test, p < 0.05), NR2B is decreased by 41.2% in the KOs (n = 5 mice per genotype; Student’s t-test, p < 0.05), whereas NR2A has a 30.3% reduction in KO mice but is not significantly different from WT (n = 5 mice per genotype; Student’s t-test, p = 0.20; n = 4 animals per genotype). Immunoblot analysis on synaptosomal fraction shows that AMPA receptor subunits, (E) GluR1 and (E′) GluR2, are not affected in N1cKO mice as compared to the WT littermates (n = 3–6 independent experiments). (F) Bar graph indicates no difference in the expression of GluR1 (n = 5 mice per genotype; Student’s t-test, p = 0.16) and GluR2 (n = 5 mice per genotype; Student’s t-test, p = 0.95) between WT and N1cKO mice. (G) Bar graph showing the fold changes in transcript expression of NR1 (Nr1), NR2B (Nr2b), NR2A (Nr2a) and GluR1 (Glur1). Only mRNA levels of NR1 (0.62 ± 0.02 vs. 1 ± 0.13, n = 3–4 animals per genotype; Student’s t-test, p < 0.05) and NR2B (0.75 ± 0.09 vs. 1 ± 0.06, n = 4 animals per genotype; Student’s t-test, p < 0.01) are decreased in KO hippocampi as compared to WT. (H,H′) Immunoblots on synaptosomal (P2) and soluble (S2) fractions. (H) NR1 is reduced, whereas GluR1 and PSD95 tagging at the synapse appear unaffected. GAPDH is used as a positive control for the cytosolic fractions. (H′) GluR2 expression is not changed at the synaptic level (n = 4 independent experiments). (I) NMDAR- and AMPAR-mediated evoked responses in CA1 pyramidal neurons. Scaled sample current traces recorded at −70 mV (gray traces) and +40 mV in the presence of CNQX (black traces) from WT and N1cKO mice. For easier comparison of NMDAR/AMPAR ratio, the current at +40 mV was scaled to the peak current at −70 mV of the same recording. (J) Bar graph shows that the mean NMDAR/AMPAR is significantly decreased in N1cKO mice (n = 13–15 neurons per genotype; Student’s t-test, p < 0.006). Data are averages ± SEM, *p < 0.05 and **p < 0.01.

