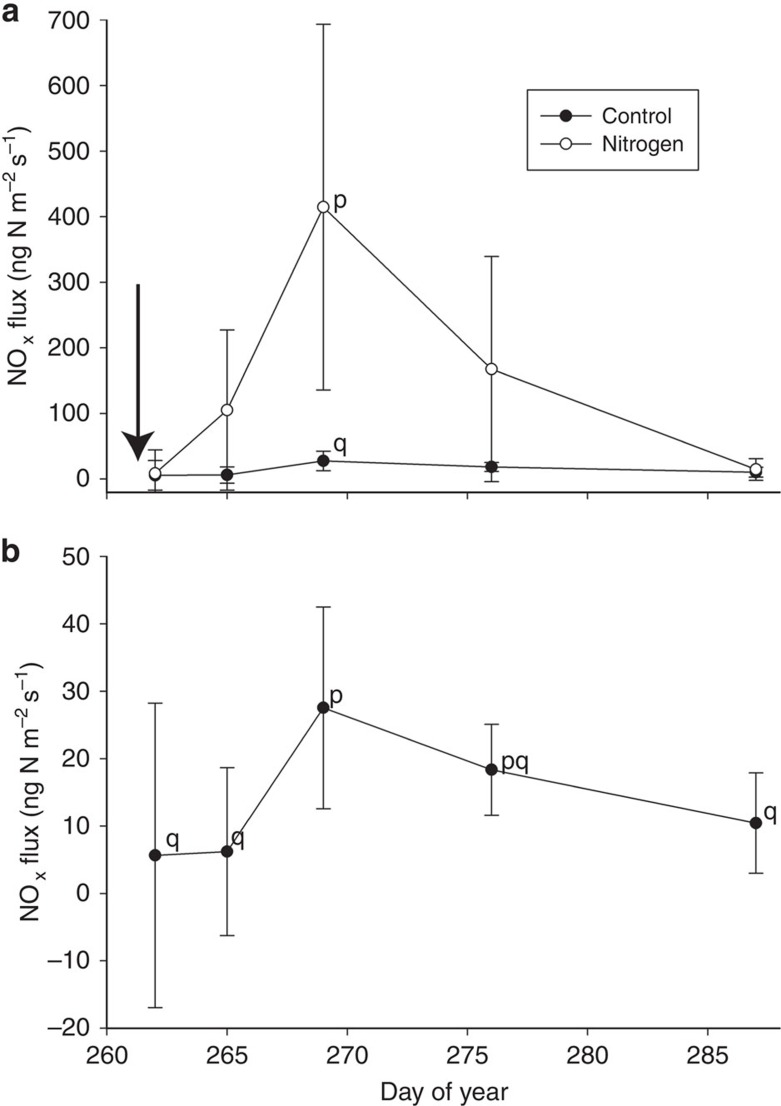
Figure 2. Pulse NOx emission responses to dissolved ammonium nitrate fertilization.
(a) Soil NOx fluxes observed during a N-fertilization experiment in 2012 where collars received 20 kg ammonium nitrate-N ha−1 in dissolved form during an irrigation (white circles; n=10) and control collars received irrigation only (black circles; n=10; s.d. bars shown). The irrigation and fertilization event is indicated by an arrow (DOY 262). N treatment significantly increased NOx emissions with peak emissions observed 7 days post fertilization. (b) Control collar NOx fluxes were also evaluated in a separate analysis to investigate the influence of irrigation alone on NOx flux. Control NOx fluxes were significantly affected by time during the experiment in response to irrigation, where fluxes observed during the third measurement (7 days post treatment) were significantly different from all other measurements except for the fourth measurement (14 days post treatment). Significant differences between time points are indicated by letters (p, q) at P<0.05, as determined using pairwise comparisons with Bonferroni adjustment.

