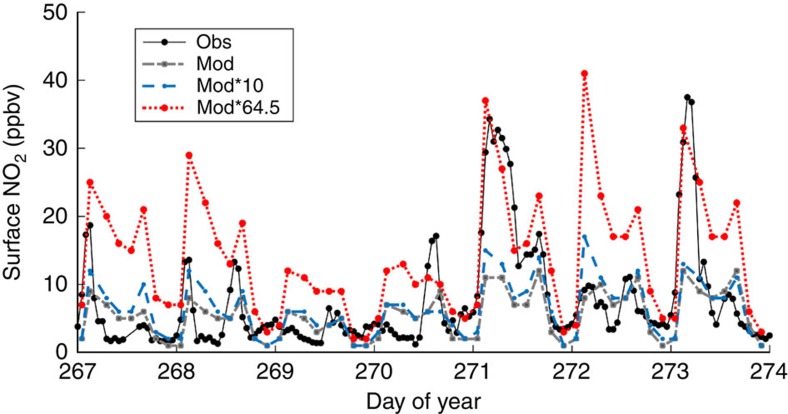
Figure 4. Comparing time series of modelled and measured surface concentrations of NO2 in the Imperial Valley, CA.
Surface concentrations of NO2 measured at an air quality monitoring station (obs) in El Centro, CA (CA Air Resources Board) and modelled with WRF-Chem (mod) and WRF-Chem with soil NO2 emission rates multiplied by 10 (mod*10) and 64.5 × (mod*64.5). All data are from 23 to 29 September 2012.

