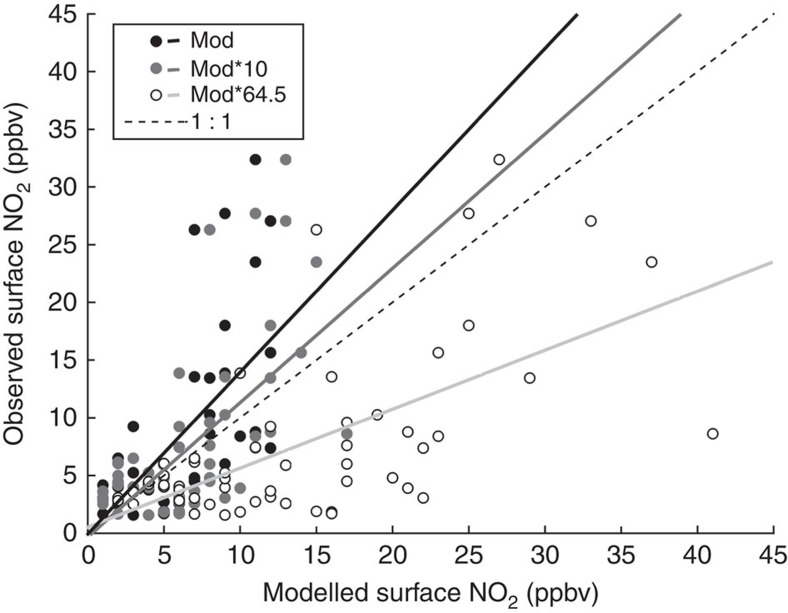
Figure 5. Comparing modelled and measured surface NO2 concentrations in El Centro, CA.
Surface concentrations of NO2 (p.p.b.v.) at an air quality monitoring station in El Centro, CA (CA Air Resources Board; obs) and modelled with WRF-Chem (mod) and WRF-Chem with soil NO2 emission rates multiplied by 10 (mod*10) and 64.5 (mod*64.5). All data are from 23 to 29 September 2012. The dashed line represents the 1:1 relationship; all other lines correspond to linear regressions between modelled and observed data (default model r2=0.44, slope=1.4, intercept=0.14; mod*10 r2=0.44, slope=1.1, intercept=0.38; mod*64.5 r2=0.42, slope=0.5, intercept=0.7). All linear regressions were significant at P<0.0001.

