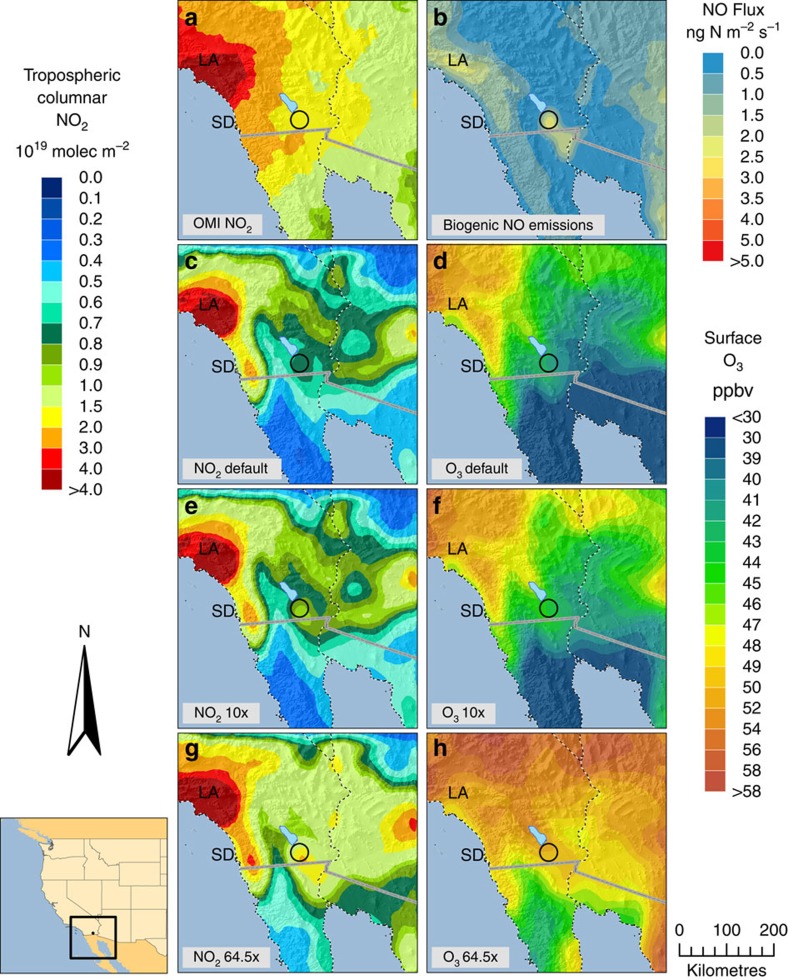
Figure 6. NO2 and O3 distributions from WRF-Chem and OMI above the Imperial Valley.
Distribution of tropospheric columnar NO2 retrieved by (a) OMI across 3 days (25, 28 and 29 September 2012) measured at 12:00–13:30 local time. WRF-Chem (b) surface NO2 emissions (ng N m−2 s−1) and (c) tropospheric NO2 columns are also shown across the same 3 days at 12:00–13:30 local time. Soil NO2 emission rates from cropland were elevated within WRF-Chem (e) 10 × and (g) 64.5 × above default resulting in higher tropospheric NO2 columns. WRF-Chem simulations of surface O3 concentrations (p.p.b.v.) are also shown corresponding to the (d) default, (f) 10 × and (h) 64.5 × elevated soil NO2 emission runs. All tropospheric NO2 column units are in 1019 molecules NO2 per m2. The Imperial Valley study region is circled in black in each panel. Nearby cities are also indicated within each panel as San Diego (SD) and Los Angeles (LA).

