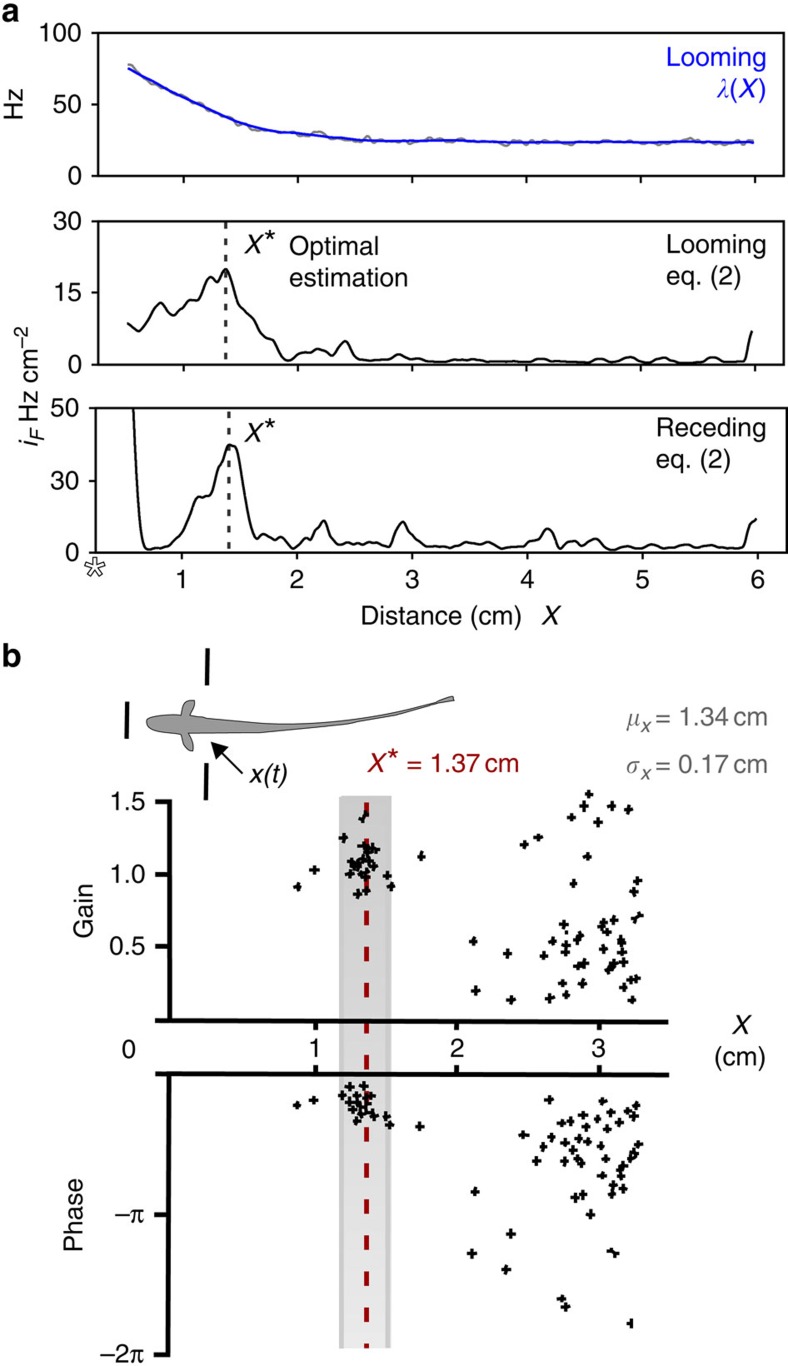
Figure 2. Precise motion tracking aligns with optimal distance estimation.
(a) Top, in response to the 2 cm s−1 looming stimulus (d=1.21 cm), the average firing rate of an ON/OFF cell population is plotted against object distance (light grey). The firing rate was then smoothed with a 250 ms moving average filter (blue) to remove small fluctuations, while preserving the stimulus-induced trend. Middle, the nonparametric measure (iF; equation (2)) is computed from the firing rate and plotted as a function of distance from the leading edge of the stimulus to the skin (x(t)). For 2 cm s−1 motion, this equation is maximal at x=1.37 cm, as marked by the dashed line, indicating that this is the point where IF is maximal. Repetition of this procedure for speeds of 1, 3 and 4 cm s−1, yielded highly similar results with a mean and s.d. of 1.37±0.01 cm, denoted as x* throughout. Bottom, the theory predicts a local IF maximum at 1.39 cm for the receding firing rates obtained under continuous motion conditions. The star at the origin indicates motion reversal, and the global maximum in iF (x<0.5 cm) is due to sudden, sharp transitions from quiescence to high-frequency bursting in the ON and OFF cells. (b) The averaged value x* is plotted as a red dashed line over the behavioural electromotor response data of Heiligenberg8 (reprinted with permission from the Journal of Comparative Physiology). The average gain (1.06±0.14) and phase (−0.68±0.26) were determined for the two data point clusters associated with excellent tracking performance, which occurred at a distance of 1.37±0.11 cm and 1.31±0.13 cm (see Methods section). The composite mean and s.d. of the two clusters (1.34±0.17 cm) is presented as grey shading, showing remarkable agreement with our predicted location for optimal estimation. Note that the other behavioural data points correspond to the fish resting nearly equidistant between the rods (6 cm separation).

