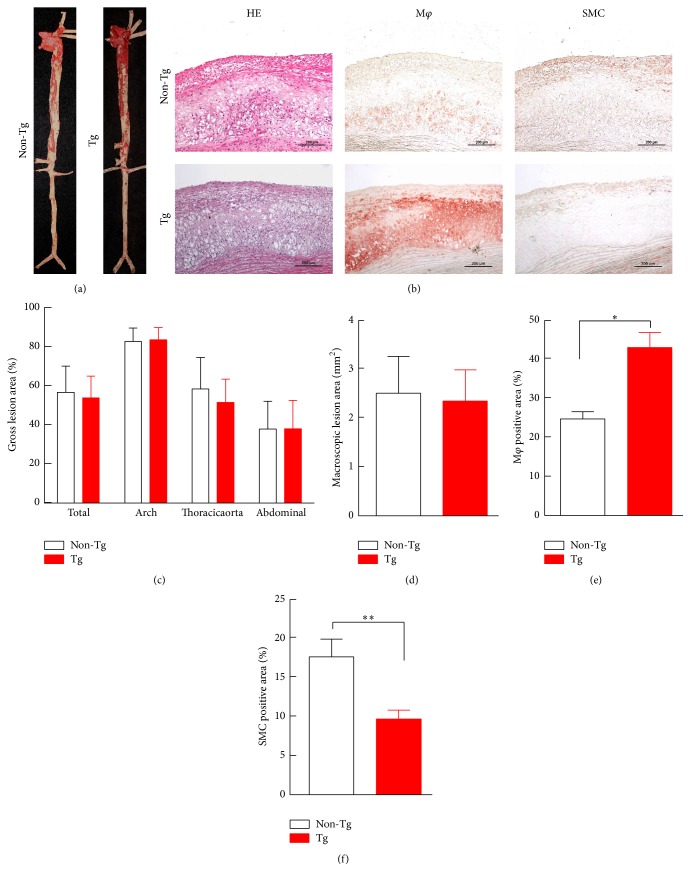
Figure 4.
Representative aortic atherosclerosis lesions ((a), (b)) and their quantitative analysis ((c)–(f)). The data are expressed as the mean ± SEM. n = 5 for each group. Representative micrographs of the intimal lesions and the cellular components (a). The aortic sections were stained with H&E or immunohistochemically stained with Abs against macrophages or smooth muscle α-actin (b). The quantitative analysis of the aortic arch lesion area and the cellular composition of the macrophages and smooth muscle cells are shown at the bottom ((c)–(f)). n = 5 for each group. The data are expressed as the mean ± SEM. ∗ P < 0.05 and ∗∗ P < 0.01 versus the nontransgenic littermates. Mφ, macrophages; SMC, smooth muscle cell; Tg, transgenic.

