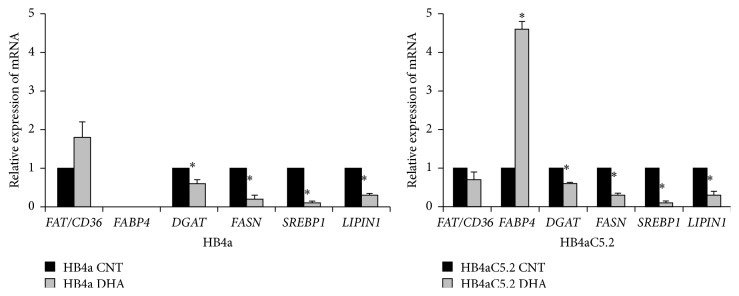
Figure 5.
Effect of DHA on HB4a and Hb4aC5.2 cells. Relative expression of FAT/CD36, FABP4, DGAT, FASN, SREBP1, and LIPIN1 in HB4a and HB4aC5.2 cells treated with DHA (100 μM for 72 h) or ethanol as a control (CNT). Data were obtained from an experiment performed in quadruplicate. The real-time PCR reaction was performed in duplicate. ∗ P < 0.001 versus CNT.

