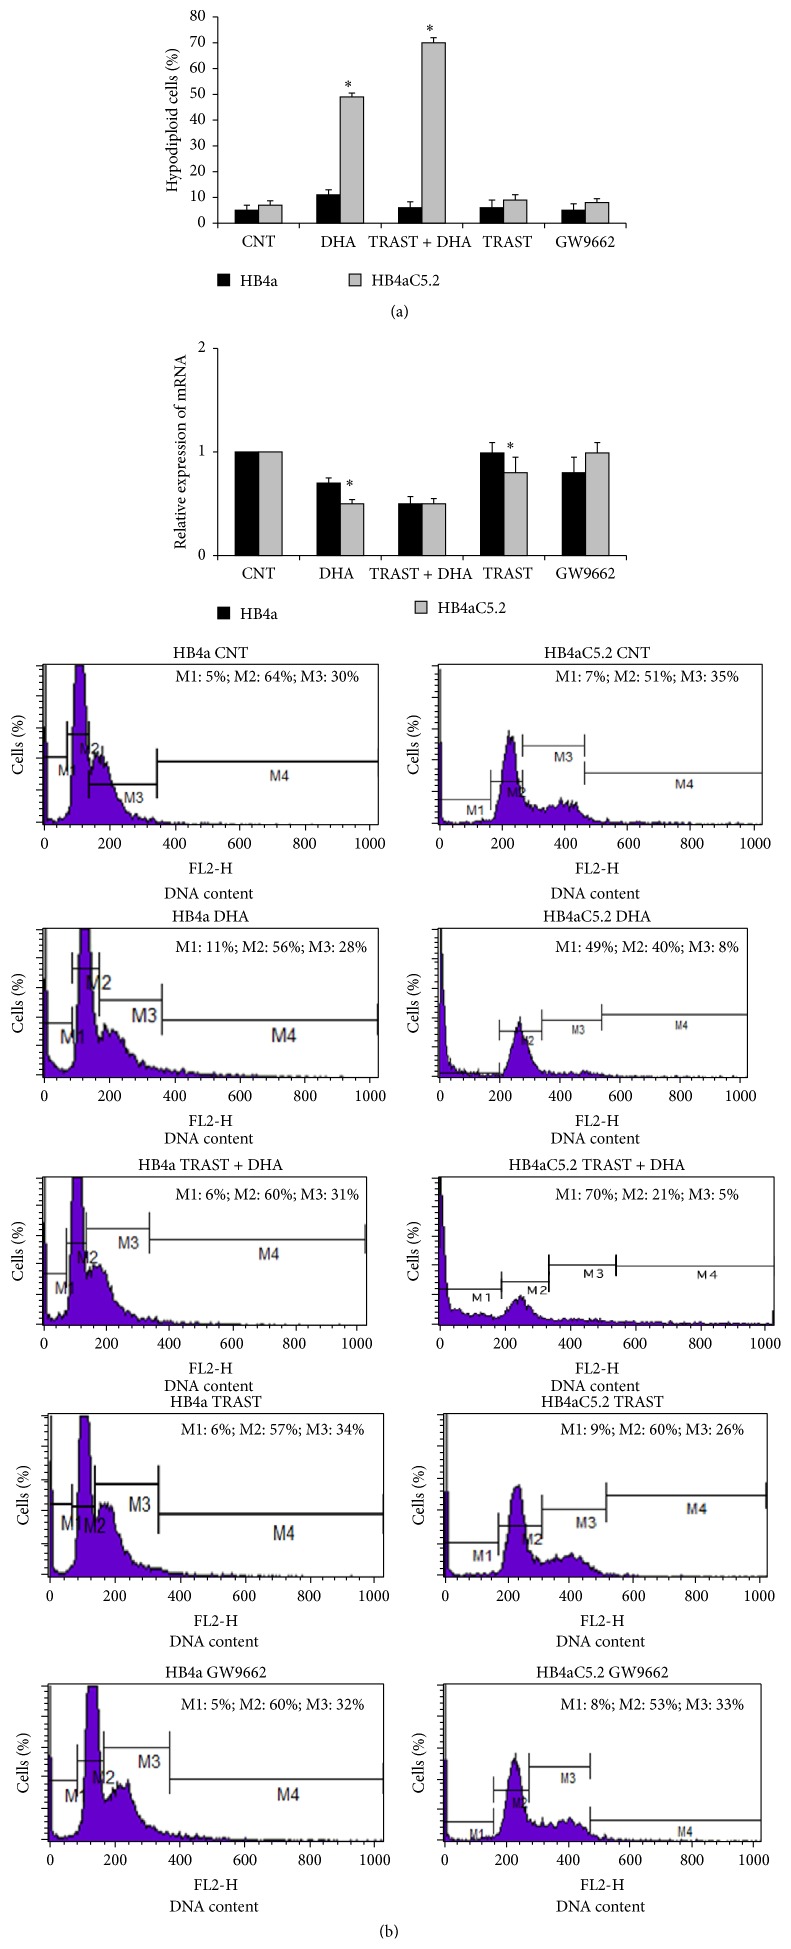
Figure 6.
Percentage of cell death induced by different treatments and relative expression of DEPTOR. (a) Percentage of cell death induced by 100 μM DHA, 15 μg/mL trastuzumab (TRAST), 15 μg/mL trastuzumab + 100 μM DHA, and 1 μL/mL GW9662 for 72 h in HB4a and HB4aC5.2 cells. Culture medium was used as a control (CNT). Subsequently, all cells were stained with PI and analyzed by flow cytometry. Cells exhibiting hypodiploid DNA content were considered to have undergone cell death. ∗ P < 0.001 versus HB4a. ∗ P < 0.001 DHA versus CNT, TRAST + DHA, TRAST, and GW9662. Data were obtained from an experiment performed in triplicate. (b) Relative expression of DEPTOR gene in HB4a and HB4aC5.2 cells treated with 100 μM DHA, 15 μg/mL trastuzumab (TRAST), 100 μM DHA plus 15 μg/mL trastuzumab (TRAST + DHA), 1 μL/mL GW9662, or culture medium as a control (CNT) for 72 h. Data were obtained from an experiment performed in quadruplicate. The real-time PCR reaction was performed in duplicate. ∗ P < 0.001 versus CNT. Results from PBS and DMSO treatments (vehicle dilution) did not differ from those obtained from treatment with standard culture medium. The histograms below the graphs represent the data obtained by flow cytometry. M1: percentage of hypodiploid cells (e.g., cell death); M2: percentage of cells in the G0/G1 phase of the cell cycle; M3: percentage of cells in the S/G2/M phase of the cell cycle; and M4: cell debris.

