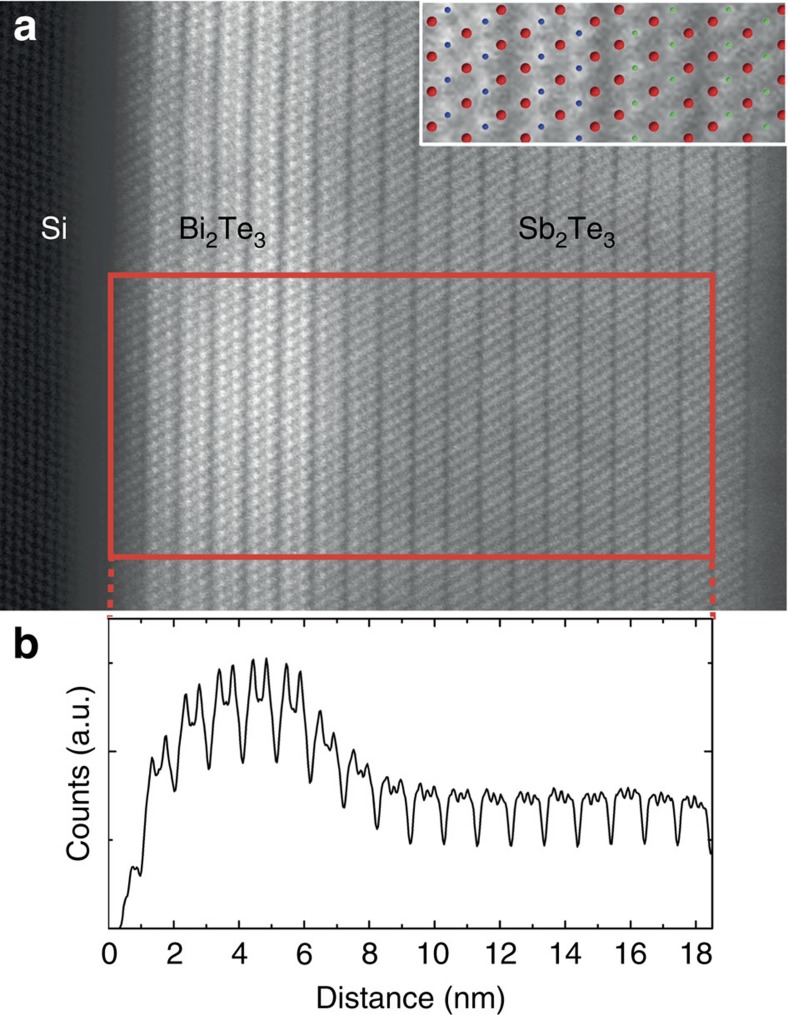
Figure 1. Structural analysis of the 15 QL Sb2Te3/6 QL Bi2Te3 sample via STEM.
(a) HAADF image of atomic resolution. The large overview image reveals the high quality of the crystal. Van der Waals gap separated quintuple layers can be observed. The contrast in the image is related to the size of the atoms on which electrons are scattered, that is, chemical contrast is obtained. To estimate the size of the intermixed interface region a line profile is plotted in b, integrated over the red rectangle in a. This line profile also serves as a scale bar for a. The inset in a shows a magnified region across the interface of the two layers with a structural model superimposed (blue atoms, Bi; green atoms, Sb and red atoms, Te).

