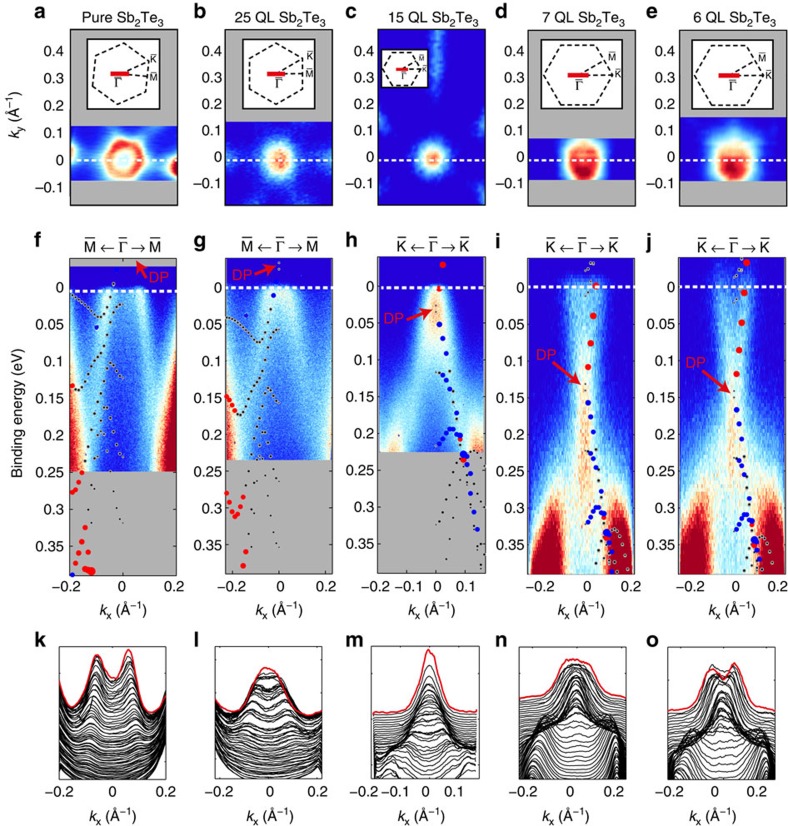
Figure 4. High-resolution ARPES close to the Fermi level using hν=8.44 eV.
(a,f,k) present the results obtained for the reference single Sb2Te3 film. For the heterostructures, the Sb2Te3 top layer thickness is marked on top. a–e depict the measured Fermi surface maps kx versus ky for EB=EF. The black dashed lines in the insets depict the hexagonal shape of the surface Brillouin zone. This symmetry character is also conserved for the shape of the surface state as one departs from the Dirac point. The white dashed lines (red line in the inset) indicate the cut direction where the corresponding normal emission spectra (f–j) were recorded. The Dirac point is marked by red arrows and the band structure calculations from DFT with adopted Fermi energy are superimposed in each spectrum. Again, red and blue dots here represent opposite in-plane spin polarization of the states. k–o show the respective momentum distribution curves at binding energies from EB=0.2 eV (bottom) to EB=EF=0 eV (top, marked by the red line) of the spectra above.

