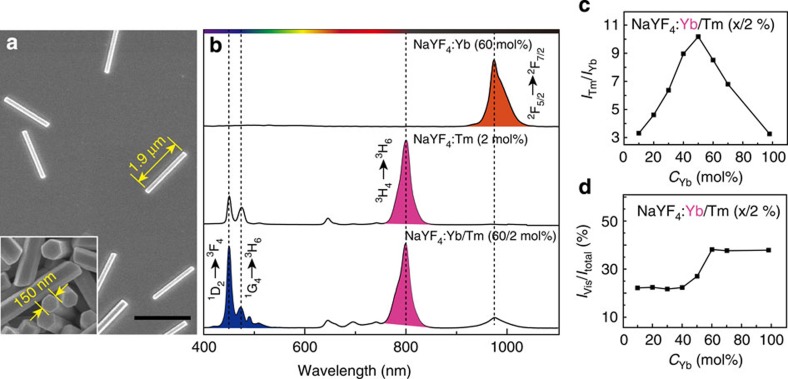
Figure 2. Spectroscopic analysis of ionoluminescence.
(a) Scanning electron microscopy (SEM) image of the as-synthesized Yb3+/Tm3+-co-doped NaYF4 nanorods under investigation. The inserted high-resolution SEM image shows hexagonal cross-sections of these nanorods. Scale bar, 2 μm. (b) Comparative emission spectra of the NaYF4-based nanorods with different dopant compositions when irradiated with α-particles. (c) The plot of the emission ratio of Tm3+ and Yb3+ (ITm/IYb) as a function of Yb3+ doping concentration, supporting the energy transfer between the two lanthanide ions. (d) Optimization of Yb3+ doping concentration for maximal emission output in the visible range. The ratio of IVis/Itotal represents the percentage of integrated visible emission in the total emission covering the range from 350 to 1,100 nm.

