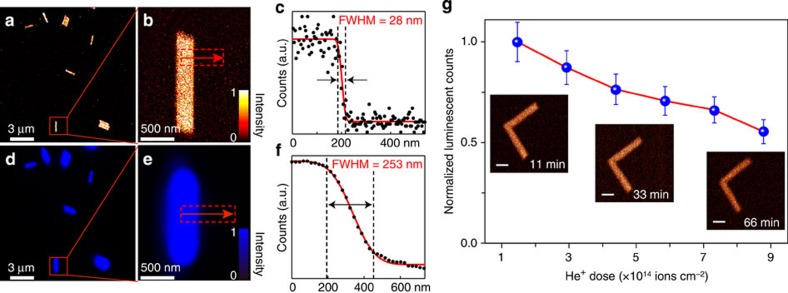
Figure 3. Luminescence imaging of NaYF4:Yb/Tm (60/2 mol%) nanorods.
(a) Ionoluminescence image of the as-synthesized nanorods through α-particle excitation. (b) High-magnification ionoluminescence image of a single nanorod as marked in a. (c) The corresponding line-scanning profile extracted from the intensity counting at the region marked in b along the arrow, indicating an imaging resolution of about 28 nm. (d) Photoluminescence image of the same sample taken by using 980 nm laser excitation. (e) High-magnification photoluminescence image of the same nanorod as shown in b. (f) The corresponding line-scanning profile from the image shown in e showing a diffraction-limited resolution of 253 nm associated with conventional upconversion microscopes. (g) Ionoluminescence intensity profile as a function of the accumulated dosage of helium ions showing the considerable iono-bleaching resistance of the nanorods. The inserted images, taken at different time intervals (11, 33 and 66 min), indicate that the emission brightness of the nanorods remains essentially unaltered over time. Scale bars, 500 nm. The error bar represents the standard deviation of luminescence counts obtained from a single nanorod in two separate measurements.

