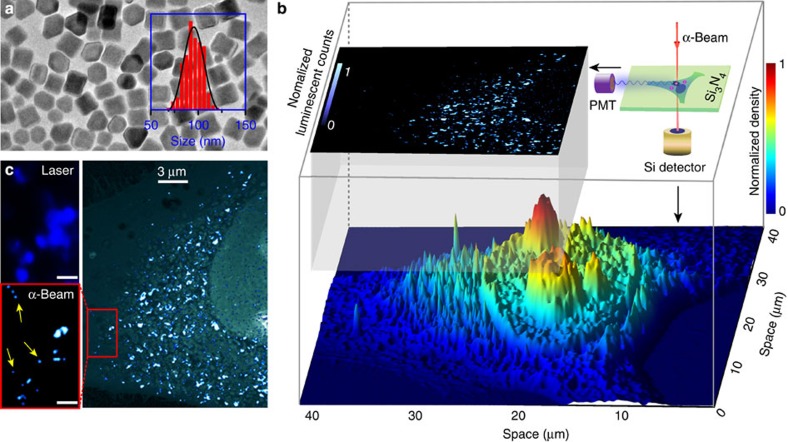
Figure 4. Particle-distribution mapping by ionoluminescence imaging.
(a) Transmission electron microscopy image of the as-synthesized NaYF4:Yb/Tm (60/2 mol%) nanoparticles. The inserted histogram shows the size distribution of these nanoparticles. (b) Basic experimental design for structural determination and ionoluminescence imaging of the HeLa cell after uptake of the nanoparticles. The luminescence mapping of the nanoparticles and the 3D rendering of detailed cellular structures can be simultaneously implemented by capturing α-particle-induced photons through a photomultiplier tube (PMT) and by scanning transmission ion microscopy, respectively. (c) Comparative photoluminescence (top left) and ionoluminescence (right) imaging, with the latter clearly showing the ability to resolve single nanoparticles (marked by the arrows as shown in the magnified image). Note that top-left and bottom-left images are taken from the same section of the cell. Scale bars, 1 μm. Note that the photoluminescence image was generated by using a 980-nm-diode laser (Supplementary Fig. 12).

