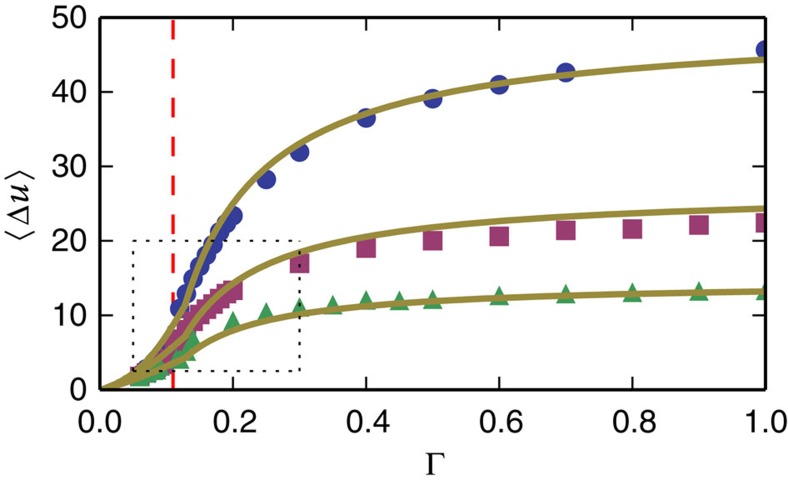
Figure 8. First moment.
Average potential energy drops versus maximal strain amplitude for different system sizes: N=16,384(blue circles), N=4,096(purple squares), N=1,024(green triangles). The yellow lines are the theoretical results equation (11) where the integral was calculated numerically. The red-dashed line marks the transition to chaos point for N=16,384.

