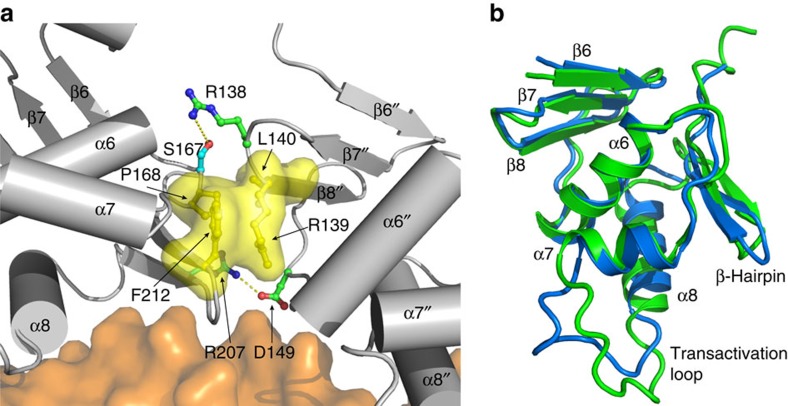
Figure 2. DBD–DBD interface and conformational changes in DBD.
(a) The interactions between two DBDs bound with the promoter DNA. The DBD in PmrA-1 is on the left and in PmrA-2 is on the right. The side chains that form salt bridge interactions are shown with sticks and those that form hydrophobic contacts are yellow sticks and surfaces. (b) Comparison of structures of isolated PmrA DBD (green) and the DBD in PmrA-1 (blue). The r.m.s.d. value between two structures is 1.02 Å for Cα atoms from residues 127–178 (β6 to α7), which suggests that the DNA binding and DBD–DBD interaction altered the conformations of the transactivation loop, the recognition helix α8 and the C-terminal β-hairpin.

