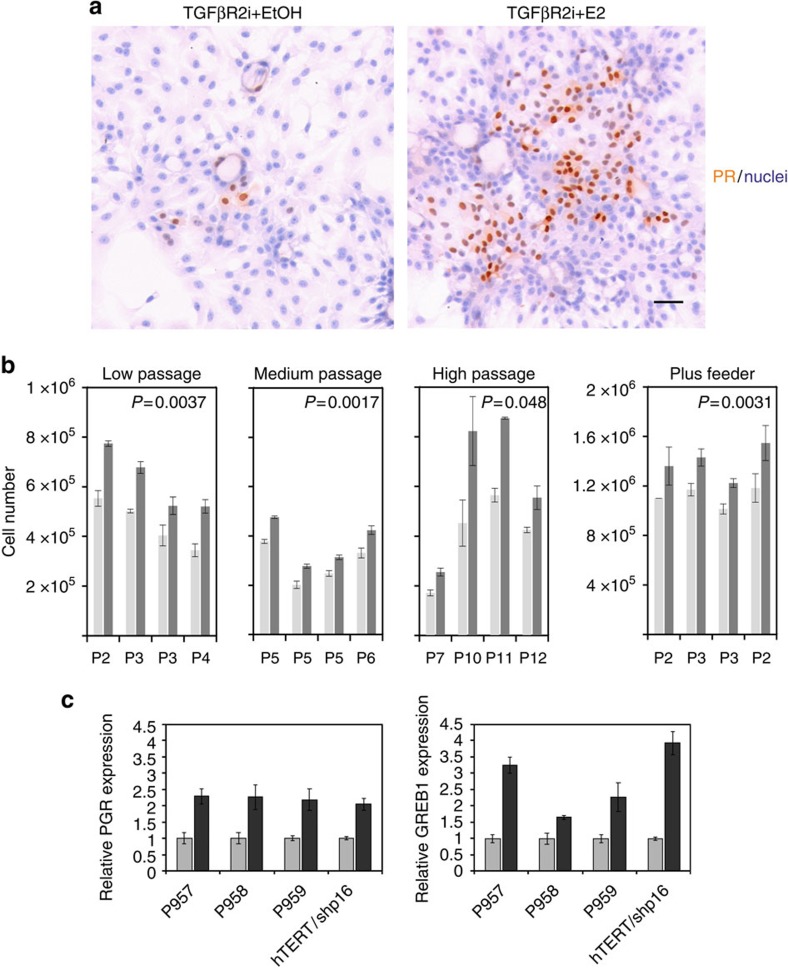
Figure 6. ERpos cells in culture respond to oestrogen.
(a) Staining of PR (SAN27) in second-passage CD166high cells deprived of EGF and exposed to vehicle (EtOH) or oestrogen (E2) for 10 days. ERpos cells respond to oestrogen by increased expression of PR. (b) Quantification of cell number in four sets of pairwise triplicate cultures of EGF-deprived, oestrogen-stimulated CD166high low-passage cells grown for 4 days in second (P959) or third passage (P958), or 13 days in fourth passage (P959); medium-passage cells grown at high density before growth for 6 days (P958), 15 days (P957) and 14 days (P957 cultured without EGF since second passage) in fifth passage or cells with extended lifespan grown for 14 days in sixth passage; or high-passage cells (hTERT/shp16) in seventh passage grown for 13 days or in tenth to twelfth passage grown for 11, 15 and 11 days, respectively, in the presence of oestrogen (dark grey) or vehicle (light grey); or pairwise triplicate cultures of CD166high cells plus feeder grown for 8 days in the presence of oestrogen (dark grey) or vehicle (light grey). Second-passage cultures derived from two different biopsies (first and fourth set of bars) do not respond differently from third-passage cultures (second set of bars), irrespective of omission of EGF from TGFβR2i before co-culture (second set of bars)). Omission of EGF throughout the entire experimental period reduced the total cell number, but did not augment the response to oestrogen (third set of bars). Error bars indicate s.d.'s. In all cases, oestrogen treatment significantly increases the growth of ERpos cells, independent of passage group (by analysis of variance (ANOVA), P<0.05). The difference between experimental and control in each passage group is statistically significant by paired t-test (P values in each diagram). (c) Relative expression in triplicate of PGR and GREB1 from second (P957 and P959) and third passages (P958), or fourteenth passage long-term (hTERT/shp16) cultured ERpos cells exposed to vehicle (EtOH, grey bars) or oestrogen (E2, black bars) for 4 (P958 and P959), 22 (P957) or 13 (hTERT/shp16) days, respectively. Transcription of downstream target genes of ER signalling, PGR and GREB1 is in all cases significantly upregulated by oestrogen as assessed by two-tailed t-test, P<0.05. Error bars indicate s.d.'s.

