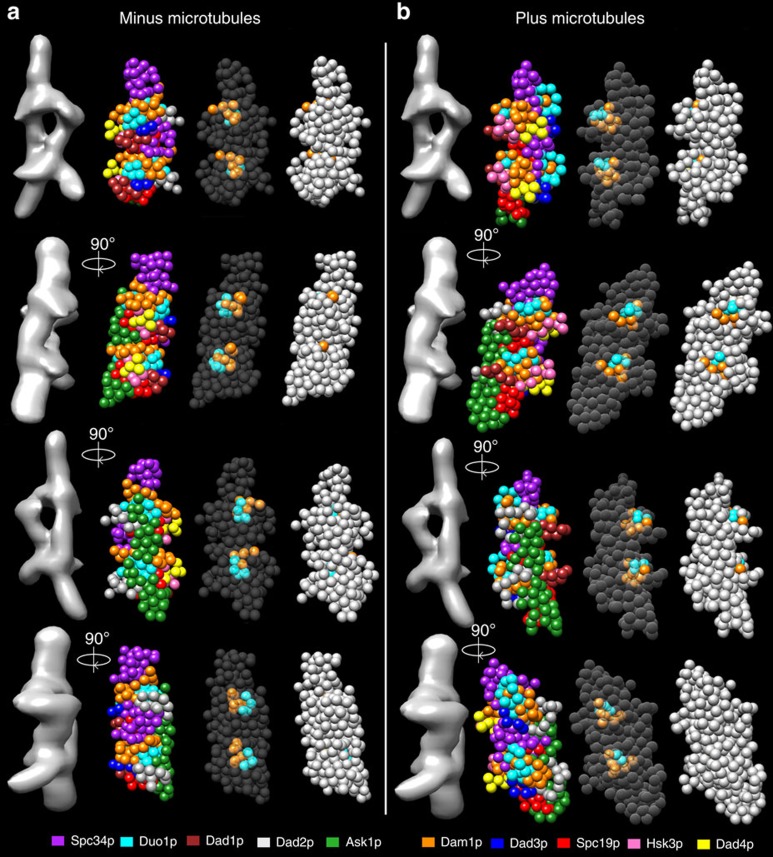
Figure 1. Structural model of the Dam1 complex.
Structural model of the Dam1 complex in the (a) absence and (b) presence of MTs. Each model represents the centre of the single cluster found in the top 1,000 models. Four orientations are shown. Each panel shows the Dam1 EM structure EMD-1372 for reference (left) followed by 3 differently coloured versions of the Dam1 structural model. The left version shows all the beads coloured according to protein (key given at the bottom of the figure). The centre version highlights only those residues that cross-link to MTs. Transparency is used to make the MT-binding region visible. The right-hand version removes the transparency so that the proximity of the MT-binding region to the model's surface can be clearly seen. It is noteworthy that in the absence of MTs, the MT-binding region is in the interior of the structure.

