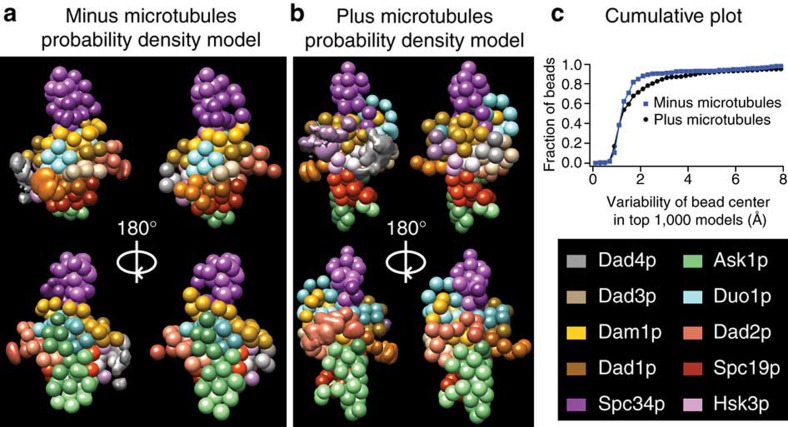
Figure 3. The precision of our modelling approach in determining the positions of all beads.
(a,b) Density maps expressing the probability that a given region of space is occupied by a bead in the top 1,000 scoring models. The space was discretized in bins of 2 Å size. The density maps of each bead are shown at half their maximum value. It is noteworthy that almost all beads are well determined and therefore look similar in the probability density map and the representative model. An exception would be the Dad2p beads (salmon color) in the presence of MTs (bottom right image). Only a Dam1 complex monomer is shown for clarity. (c) A cumulative plot of bead variability.

