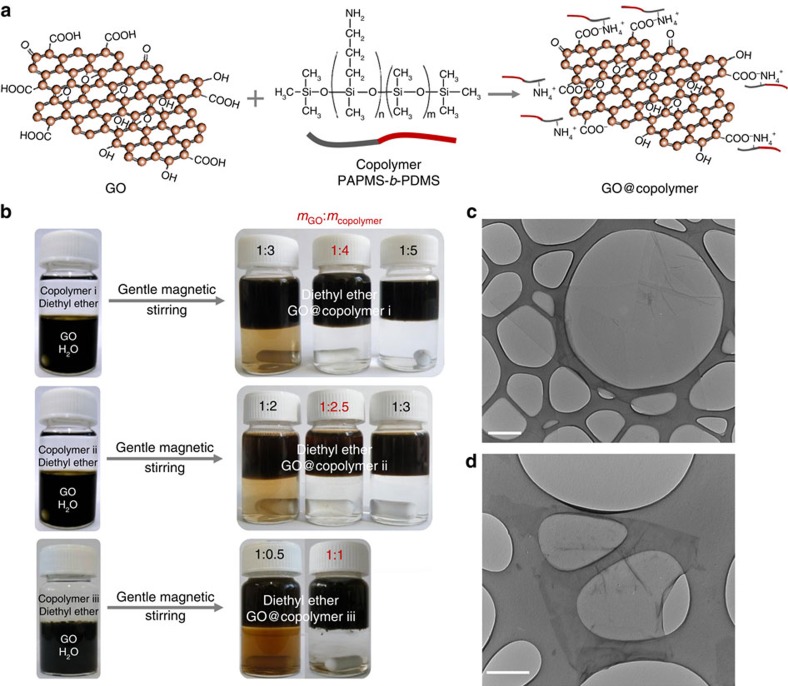
Figure 1. Phase transfer of GO from the aqueous to the organic phase.
(a) Schematic illustration of the electrostatic attraction between negative charges of GO nanosheets and positive ones of the PAPMS-b-PDMS copolymer. (b) Photographs show the phase transfer of GO flakes from the aqueous to the organic phase by using PAPMS-b-PDMS copolymers with different mole concentrations of amine groups. The starting volumes of the oil and water phases are 10 ml. The amount of GO in the starting aqueous phase is 1 mg ml−1. The phase transfers are shown as a function of the weight ratio of GO to copolymer (mGO:mcopolymer). It is considered as completed when the lower aqueous phase is uncoloured. (c) TEM image showing a flake of pristine GO. (d) TEM image of GO flakes after functionalization with copolymer i. The samples for TEM characterization are prepared by depositing a drop of sufficiently diluted pristine GO aqueous solution or modified GO organic solution onto standard TEM grids. (c,d) Scale bars, 500 nm.

