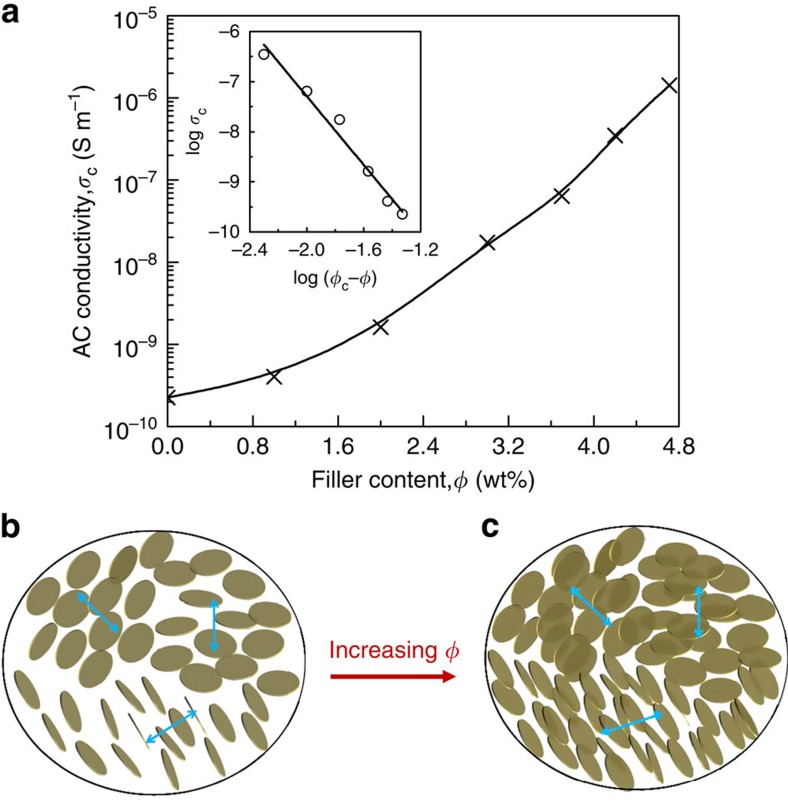
Figure 5. Interference of LC transition with percolation transition.
(a) AC conductivity of the rGO/PDMS composites as a function of the filler content, measured at room temperature and 100 Hz. Inset shows the best fit of the conductivity to a power law, which gives rise to a percolation threshold ϕc=4.7 wt% and a critical exponent s=3.42. It is worth noting that, except for the first point in which no rGO is present, all the characterized materials display a liquid-crystalline texture. (b) Microstructural representation of PDMS composites, which are composed of randomly oriented monodomains of LCs at low concentration. In each domain, the flakes tend to be aligned but no percolating path is established. (c) Schematic illustration of the microstructure of the composite at high concentration. In this case, the monodomains still remain randomly orientated but flakes inside domains begin to percolate and eventually form an infinity network of connected path through the insulating matrix.

