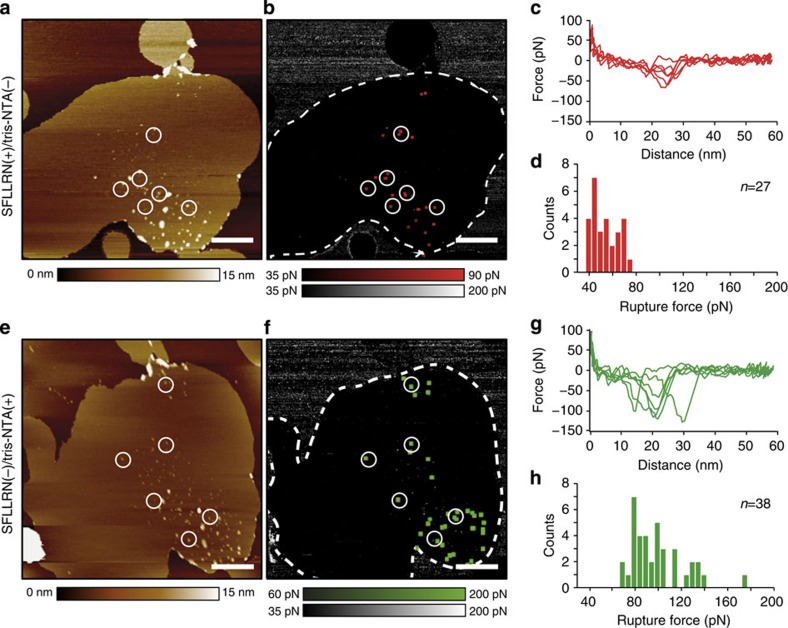
Figure 2. Imaging PAR1 proteoliposomes using bifunctionalized AFM tips and mapping the specific binding of SFLLRN or of tris-NTA ligands.
(a–d) Imaging the proteoliposome and mapping the binding of the SFLLRN ligand to PAR1. (a) AFM topograph of a PAR1 proteoliposome recorded with inactivated tris-NTA (tris-NTA(−)) and active SFLLRN (SFLLRN(+)) ligand. To prevent tris-NTA interacting with the His10-tag of PAR1, experiments were conducted in the absence of Ni2+. (b) Adhesion map showing specific rupture forces on the proteoliposome (dashed) imaged in a. (c) FD curves recording specific interactions in b at distances corresponding to the length of the stretched PEG linker tethering the SFLLRN ligand to the AFM tip. (d) Rupture forces of single SFLLRN–PAR1 bonds range from 35 to 80 pN. (e–h) Imaging the proteoliposome and mapping the binding of the tris-NTA ligand to the His10-tag of PAR1. (e) AFM topograph of the PAR1 proteoliposome recorded with activated tris-NTA (tris-NTA(+)) and blocked SFLLRN (SFLLRN(−)) ligand. To promote tris-NTA binding to the His10-tag and to prevent the SFLLRN ligand binding to PAR1 the experiments were conducted in the presence of Ni2+ and the antagonist BMS. (f) Adhesion map showing specific rupture forces on the proteoliposome (dashed) imaged in e. (g) FD curves recording specific interactions in f. (h) Rupture forces of single tris-NTA–His10-tag bonds range from 65 to 140 pN. The encircled positions of AFM topographs and adhesion maps indicate where specific interactions were detected. Topographic heights (a and e) are indicated by colour bars. Rupture force distributions (c,d,g,h) shown at 5 pN bin size. Images were recorded in 300 mM NaCl, 20 mM HEPES, 25 mM MgCl2, pH 7.2 and if stated 2 μM BMS or/and 5 mM NiCl2. Experiments were repeated six times, each time we prepared a new sample and used different functionalized AFM tips. Scale bars, 500 nm (a,e).

