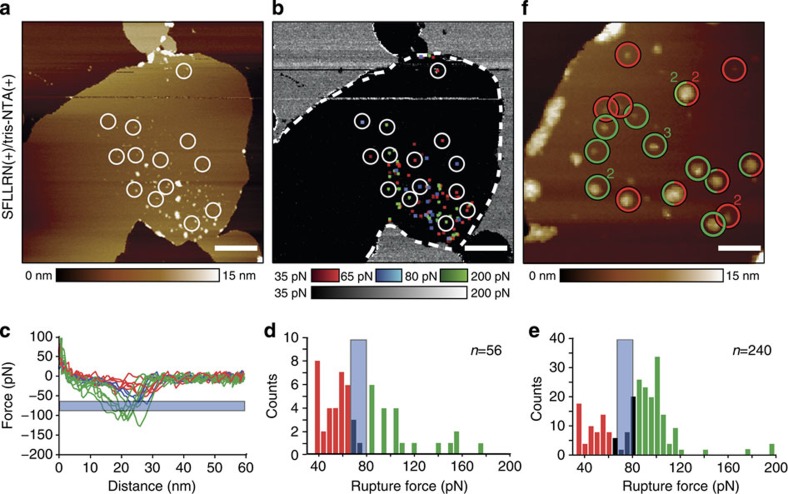
Figure 3. Mapping the binding of two different ligands while imaging PAR1 proteoliposomes.
(a) AFM topograph of a PAR1 proteoliposome. Measurements were performed in the presence of Ni2+ to allow both tip-tethered ligands, the tris-NTA and the SFLLRN peptide to interact with PAR1-binding sites. (b) Adhesion map simultaneously recorded with the topograph (a). Adhesion events detected on the proteoliposome (dashed boundary) categorize into three different interaction force scales: 30–65 pN for the extracellular SFLLRN–PAR1 bond (red), 65–80 pN for the force filter applied (blue) and 80–200 pN for the intracellular tris-Ni2+-NTA–His10-tag bond (green). (c) Selected FD curves showing specific adhesion forces; recorded at areas encircled in a,b. (d) Distribution of forces characterizing the rupture of ligand–receptor bonds. Applying a force filter from 65 to 80 pN (blue) discriminates between both types of specific interactions (red versus green). (e) Distribution of rupture forces of SFLLRN–PAR1 (red) and of tris-NTA–His10-tag (green) bonds recorded in three consecutive images of the PAR1 proteoliposome. (f) PAR1 proteoliposome imaged at higher magnification. Specific interaction sites detected after three consecutive recordings were encircled and colour coded for extracellular SFLLRN–PAR1 (red circles) and intracellular tris-NTA–His10-tag (green circles) interactions. The numbers two and three indicate that the specific interactions were detected two or three times, respectively. Topographic heights (a,e) are indicated by colour bars. Rupture force distributions (c,d,f) shown at 5 pN bin size. Images were recorded in 300 mM NaCl, 20 mM HEPES, 25 mM MgCl2, 5 mM NiCl2, pH 7.2. Experiments were repeated six (a,b) or three (f) times, each time using new sample preparations and functionalized AFM tips. Scale bars, 500 nm (a) and 80 nm (f).

