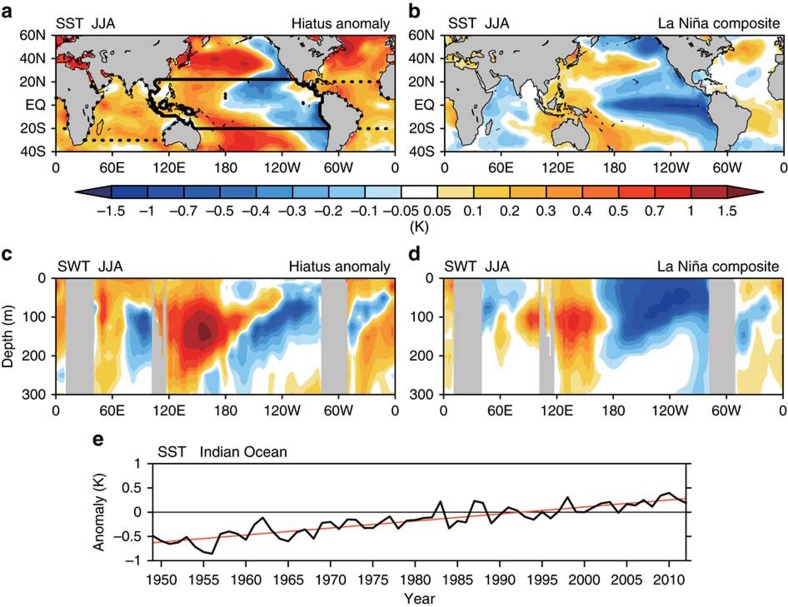
Figure 2. Global anomalies of sea water temperature in the boreal summer during the hiatus period compared with typical La Niña years.
(a) Observed SST anomalies for 1999–2013 minus 1979−1998. Regions of the Indian Ocean, the tropical Pacific Ocean and the tropical Atlantic Ocean bounded by thick lines correspond to the IO, TPO and ATL simulations, respectively (see Methods). (b) Composite SST anomalies for La Niña years (1950, 1954, 1955, 1964, 1970, 1971, 1973, 1975, 1984, 1985, 1988, 1995 and 1998) relative to the base period (1950–1998). (c) Longitude-depth section of SWT anomalies along the equator (5°S–5°N) during the hiatus period. (d) As for c, but for La Niña years. (e) Time series of SST anomalies from the base period (1979–1998) in the tropical Indian Ocean (30°S–20°N, 40°–120°E). Red line shows a linear trend (0.145 K decade−1).

