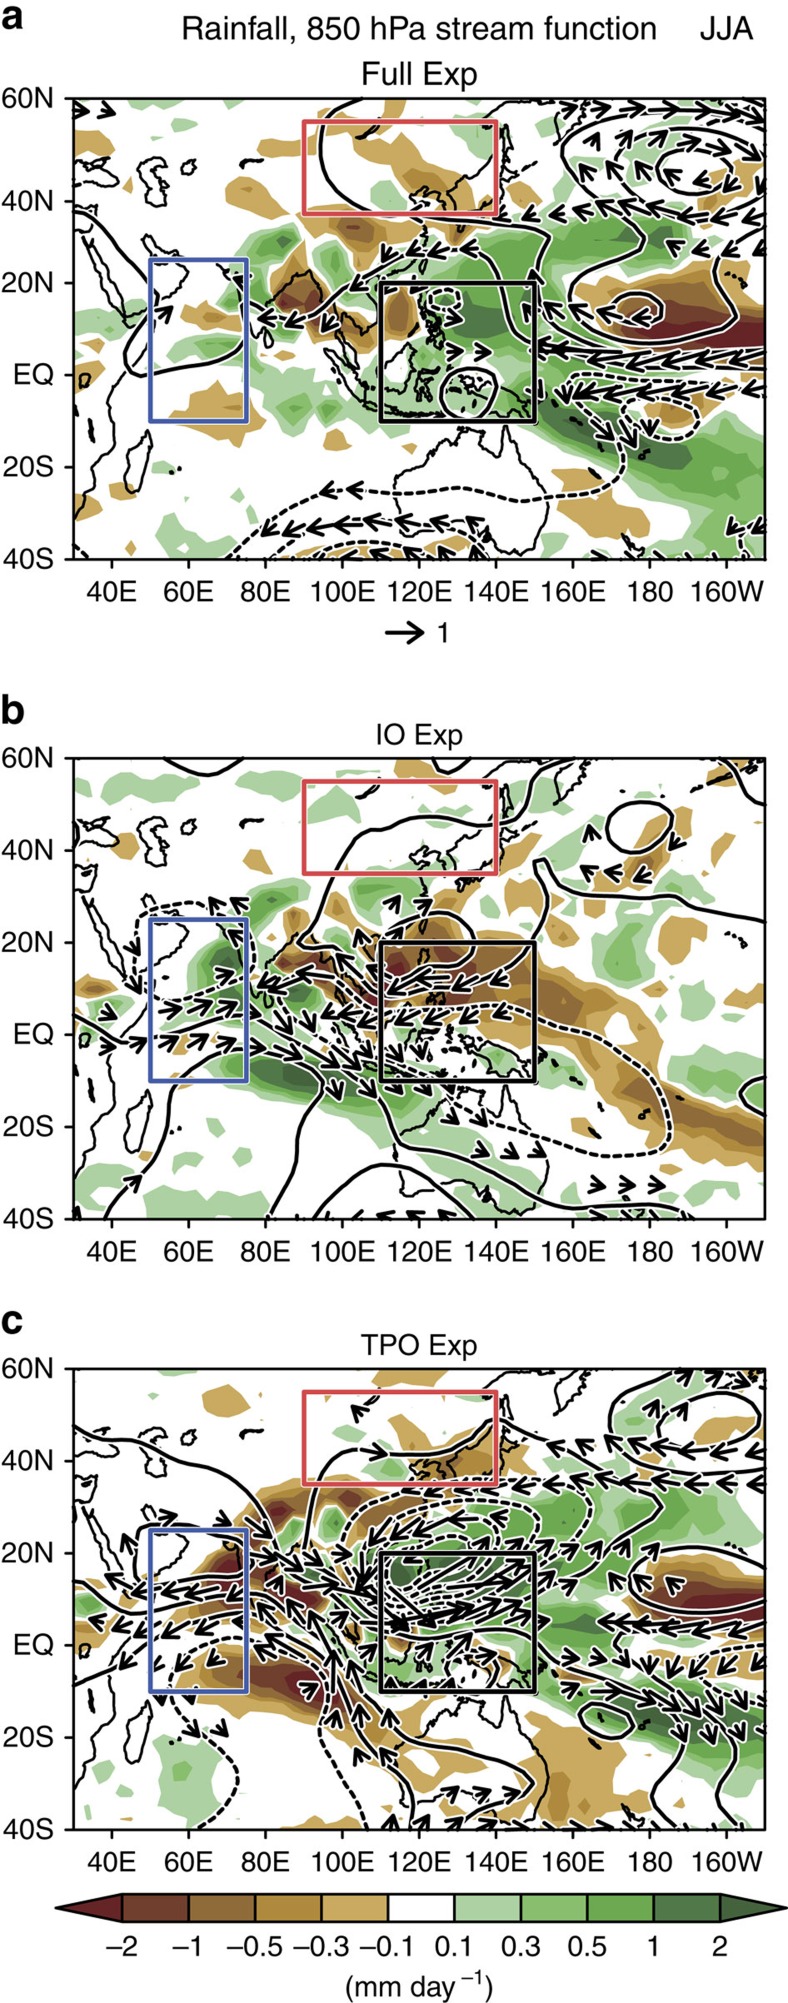
Figure 3. Simulated patterns of circulation in the Indo-Pacific region for the boreal summer.
(a) Precipitation (mm day−1), wind vectors (m s−1) and stream function (106 m2 s−1) at 850 hPa from MRI-AGCM 10-ensemble experiments, where SSTs are set to hiatus anomalies (1999–2013). (b,c) As for a, but for the effect of the Indian Ocean and tropical Pacific, respectively (see Methods). Red, blue and black rectangles show the EA, WIO and WP regions, respectively.

