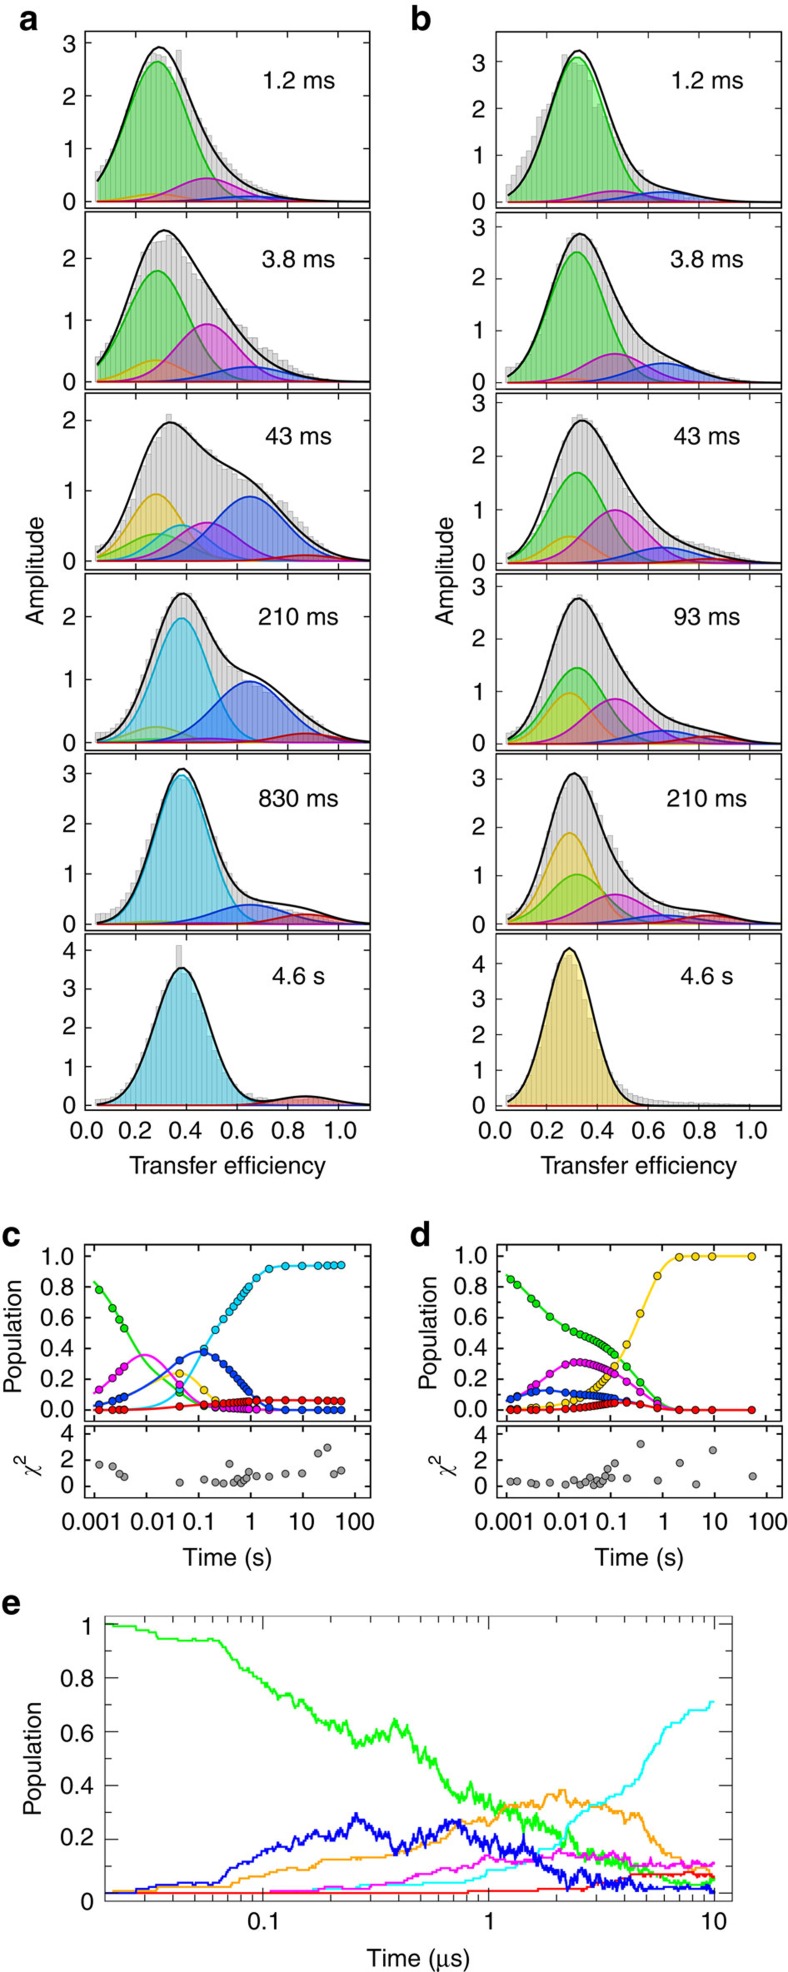
Figure 3. Single-molecule kinetics of doubly labelled I27–I27 and I27–I28 refolding.
(a,b) A selection of I27–I27 (a) and I27–I28 (b) transfer efficiency histograms (grey) recorded at increasing times (insets) after initiation of refolding in 0.23 M GdmCl in the microfluidic mixer. Gaussian fits of individual populations to the global kinetic model (Fig. 5) are colour coded as follows: green, fully unfolded (UU); yellow, one domain folded, one unfolded (FU/UF); cyan, natively folded (FF); magenta, strand-swapped misfolds with central domain formed (M1); red, strand-swapped fully misfolded species (M3); blue, non-native-like misfolds (M2; see main text); nomenclature as in Fig. 5. The sums of all populations are shown as black lines. Every histogram shown is the average of two or more independent measurements. (c,d) Plots of the time evolution of each population of I27–I27 (c) and I27–I28 (d) according to the rate coefficients obtained from the global fit of the entire histograms time series (Supplementary Figs 4 and 8a); circles indicate times where a histogram was measured. Panels below show the sum of the squared residuals (χ2) for every histogram (equation 8 in Methods). (e) Coarse-grained folding simulations displaying the relative population of each state (colour-coded as above), including the intramolecular amyloid-like misfolds M2 (blue), as a function of time.

