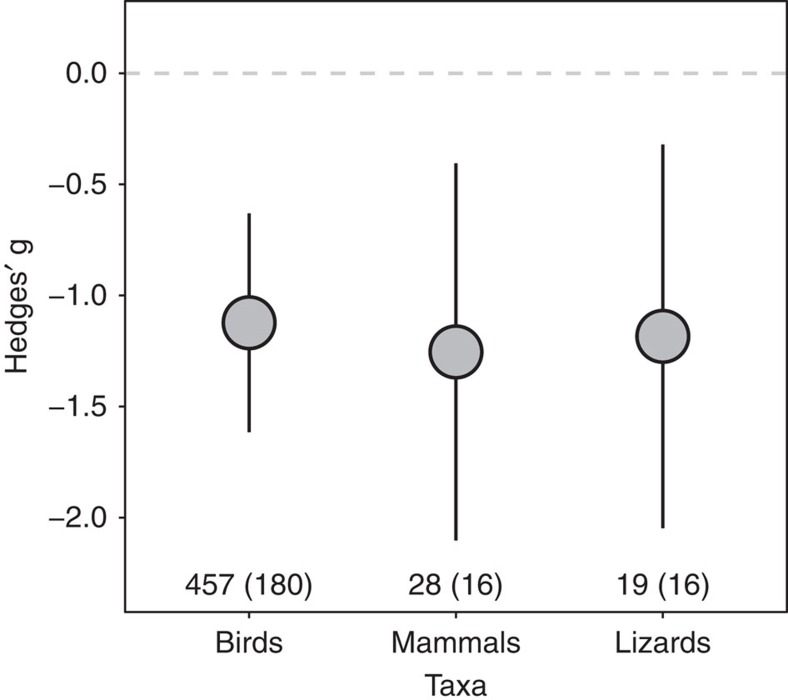
Figure 1. Mean (±95% confidence interval) effect sizes (Hedges' g) by taxa which compare the difference between flight initiation distances of populations under high and low human disturbance.
Number of effect sizes and species (the latter in parenthesis) sampled by taxa is shown in the bottom of figure. Horizontal dashed line indicates zero effect size. Negative values illustrate tolerance of human disturbance.

