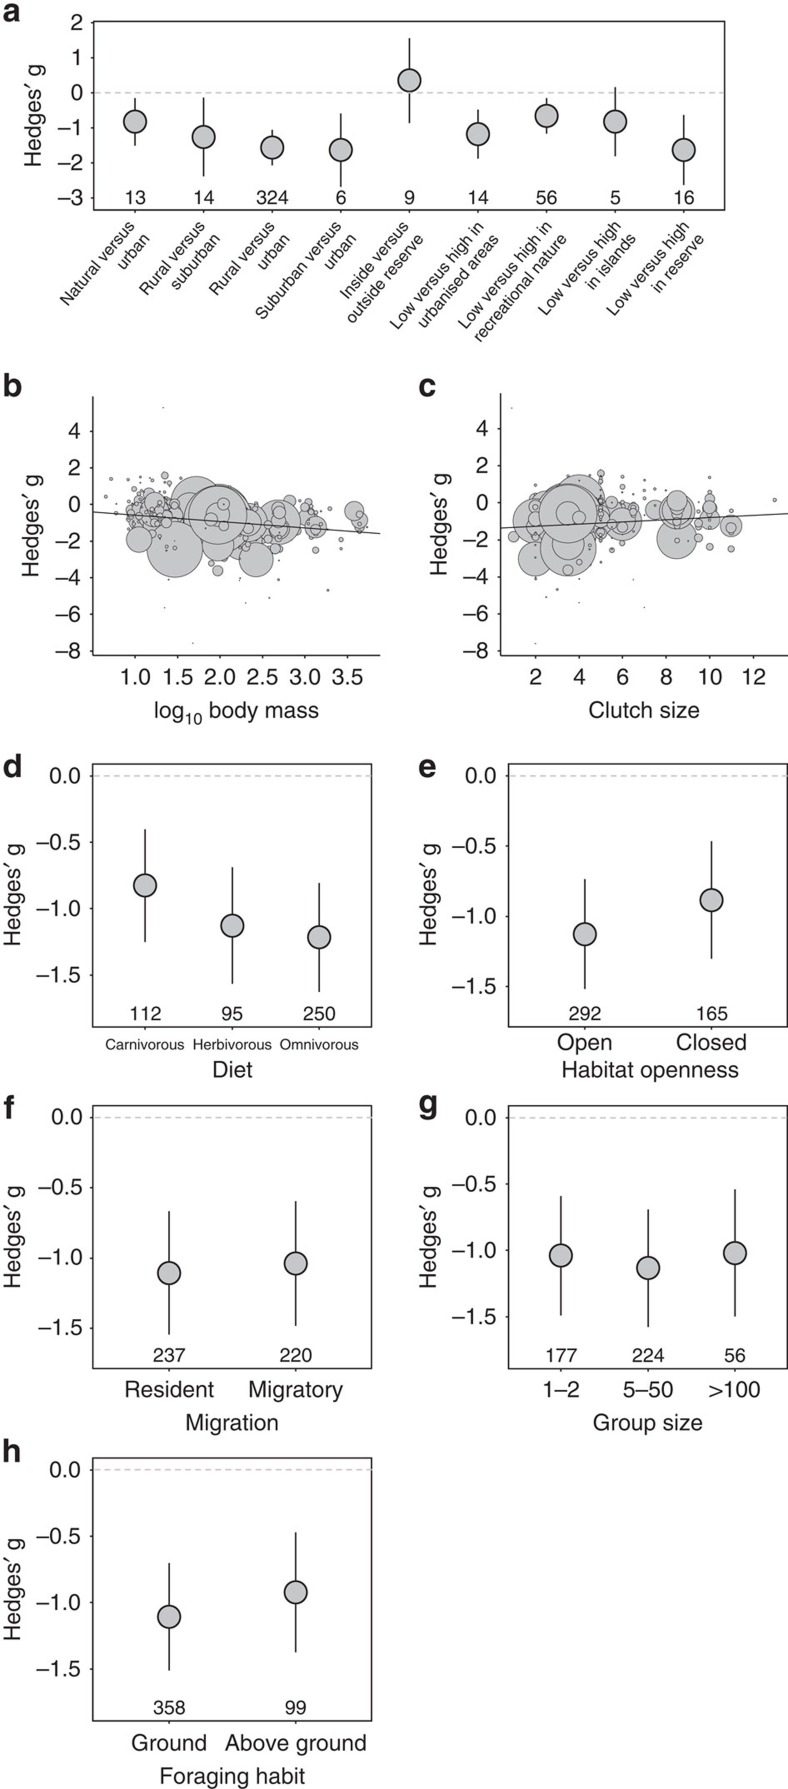
Figure 2. Effects of eight predictors on the effect sizes (Hedges' g) of bird's tolerance of human disturbance using the full data set (180 species, 457 effect sizes).
Negative effect sizes show that species tolerate human disturbance, whereas positive effect sizes show that species are intolerant of human disturbance. Predictors are presented in their order of importance in explaining bird's tolerance (or intolerance) to human disturbance. (a) Type of habitats contrasted (contrasts are presented as habitat with ‘low versus high' human disturbance). Habitat contrasts presented as ‘low versus high in' refer to contrast between populations experiencing low and high human disturbance within a given habitat type. (b) Body mass (g). (c) Mean clutch size per reproductive period. (d) Diet. (e) Habitat openness. (f) Migration. (g) Group size. (h) Foraging habit. Horizontal dashed line indicates zero effect size. Different sizes of symbols in b and c reflect differences in sample size. The error bars illustrate 95% confidence intervals. The number of effect sizes in each categorical level is shown in the bottom of figures.

