Figure 3.

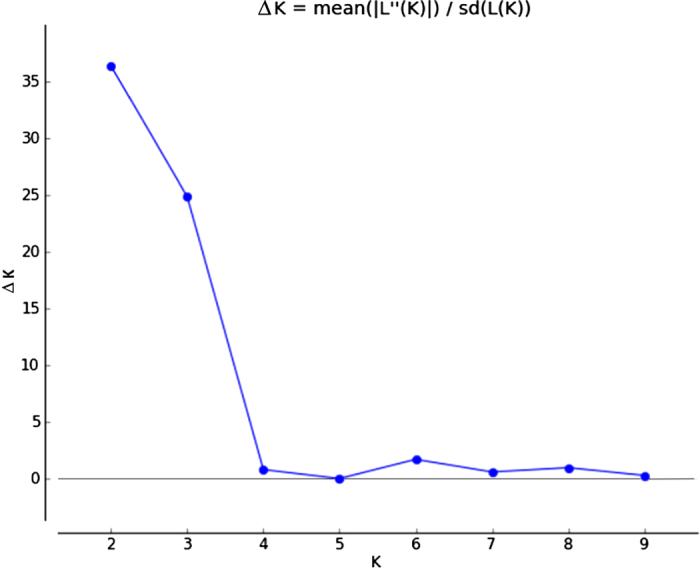
Plot of ΔK (filled circles, solid line) calculated as the mean of the second-order rate of change in likelihood of K divided by the standard deviation of the likelihood of K, m|L″(K)|/s[L(K)].

Plot of ΔK (filled circles, solid line) calculated as the mean of the second-order rate of change in likelihood of K divided by the standard deviation of the likelihood of K, m|L″(K)|/s[L(K)].