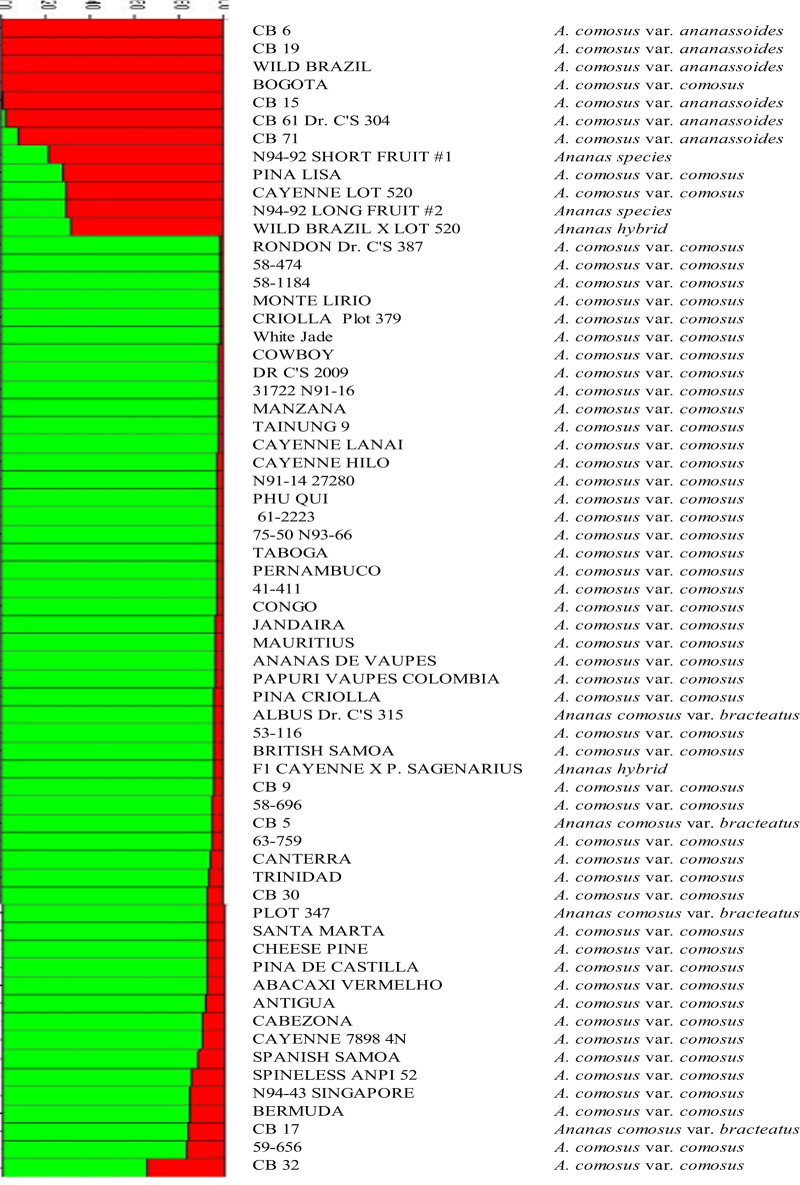
Figure 4.
Inferred clusters in the pineapple accessions varieties using STRUCTURE in the overall analyzed pineapple accessions. Each vertical line represents one individual multilocus genotype. Individuals with multiple colors have admixed genotypes from multiple clusters. Each color represents the most likely ancestry of the cluster from which the genotype or partial genotype was derived. Clusters of individuals are represented by colors.

