
Figure 5. E-site tRNA dissociates more rapidly from the PRE2 complex.
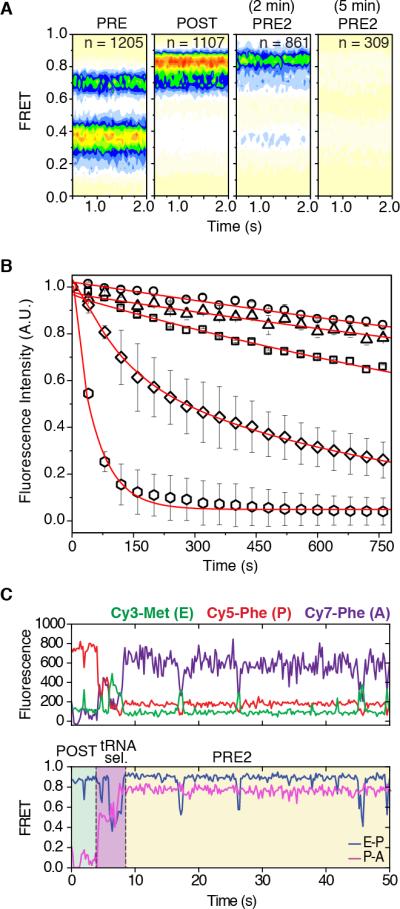
(A) Population FRET histograms show the distribution of states in the PRE complex (first panel), POST complex (second panel), PRE2 complex after 2 min (third panel) and the PRE2 complex after 5 min (last panel). (B) Cy3-tRNAMet dissociation from the E site tracked by the loss of fluorescence via time-lapse imaging. E-site tRNA stability for 80S IC (~0.03 min−1) squares; PRE (~0.02 min−1) circles; POST (~0.02 min−1) triangles; PRE2 (~0.25 min−1) diamonds; PRE2 + eEF2 (~1.2 min−1) hexagons. Data are represented as mean +/− SD. (C) A representative pre-steady state single-molecule FRET trace of productive aa-tRNA selection showing dynamic motions within the ribosome bearing three fluorescently-labeled tRNAs. The area in green indicates the time occupied by a stable POST complex before delivery of Cy7-labeled ternary complex; tRNA selection is highlighted in blue; the PRE2 complex is highlighted in yellow. See also Figure S5.