
Figure 7.
Competition between LTP and LTD eligibility traces results in stable reinforcement learning.
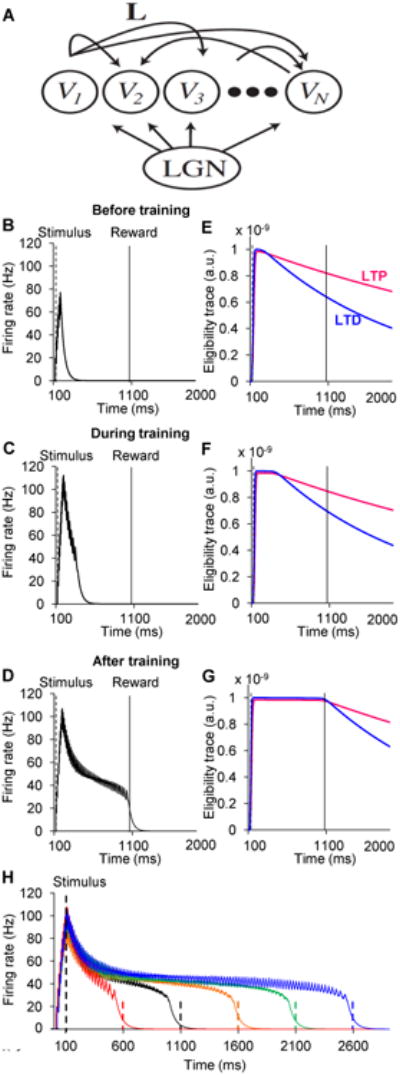
(A) Diagram of recurrent network of excitatory neurons representing cells in visual cortex driven by feed-forward input from LGN.
(B-D) Simulated average population firing rate computed from a recurrent network of 100 integrate-and-fire excitatory units. The network is trained to report a 1 second time interval after a 100 ms stimulation. Three instances of network dynamics are shown: B, before training; C, during training (18 trials); and D, after training (70 trials).
(E-G) Time evolution of LTP- and LTD-promoting eligibility traces corresponding to the same trials as in B - D. Magenta lines are LTP eligibility traces, and blue lines are LTD eligibility traces. LTP and LTD eligibility traces both increase during the period of network activity (see above). LTD traces saturate at higher effective levels. At the beginning of training (E), LTP traces are larger than LTD traces at the time of reward, and therefore LTP is expressed. At the end of training (G), LTP and LTD traces are equal, resulting in no net change in synaptic efficacy. (H) The model can be trained to predict different reward timings accurately.
See also Fig S5