
Figure 5. Redundancy analysis (RDA).
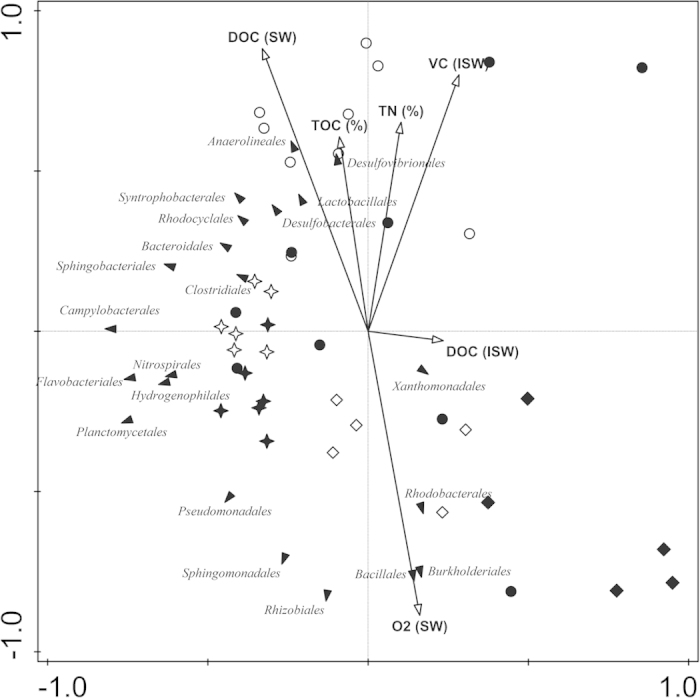
Triplot of the relationship between microbial composition at order level and environmental parameters. Orders are indicated with filled triangles, environmental parameters with black arrows. The samples of 2005, 2010, and 2011 are shown as circle, star and diamonds, respectively, with core-a samples as filled and core-b samples as empty symbols. The eigenvalues of the first (x) and second (y) canonical axes are 0.262 and 0.194, respectively. The arrow length and direction corresponds to the variance that can be explained by the environmental variable. The direction of an arrow indicates an increasing magnitude of the environmental variable. The perpendicular distance between orders and environmental variable axes in the plot reflects their correlations. The smaller the distance, the stronger the correlation. SW: surface water; ISW: interstitial water.