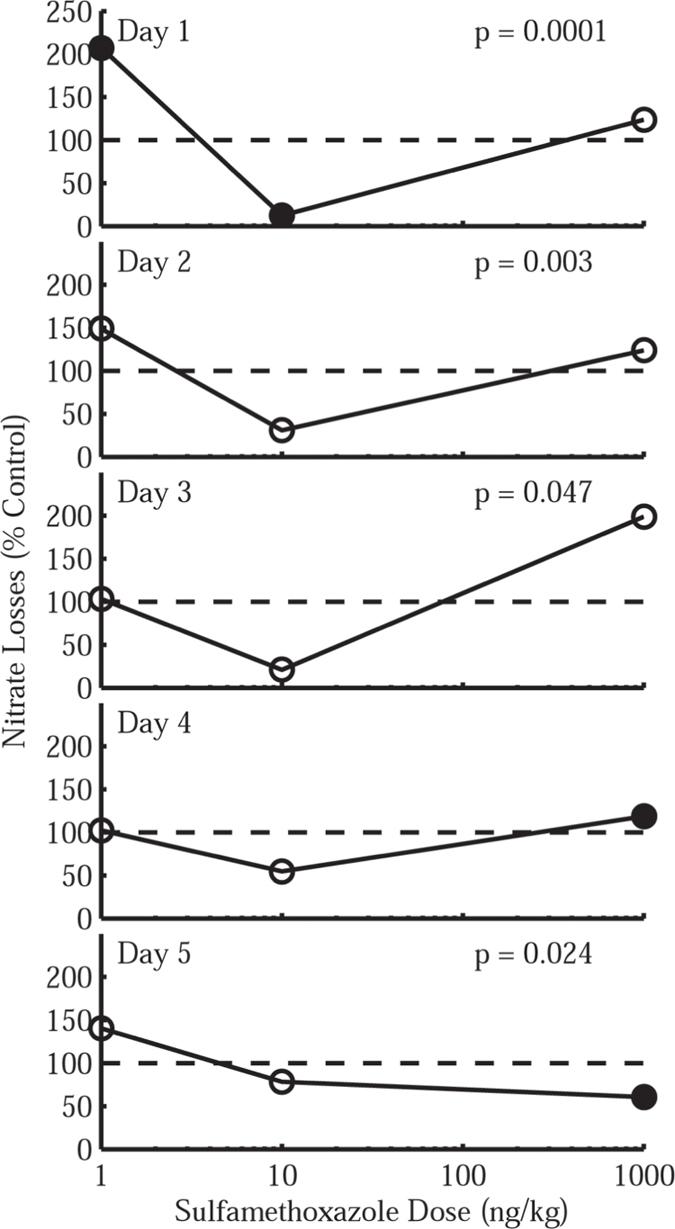
Figure 1. Time-Dose Response curves illustrating the percentage of extractable nitrate lost relative to the control in soils treated with sulfamethoxazole.

Results shown are the average of three replicates collected at each sampling period. Values above 100% (dashed line) indicate that nitrate losses are stimulated relative to the control whereas values less than 100% point to nitrate losses inhibited relative to the control.
